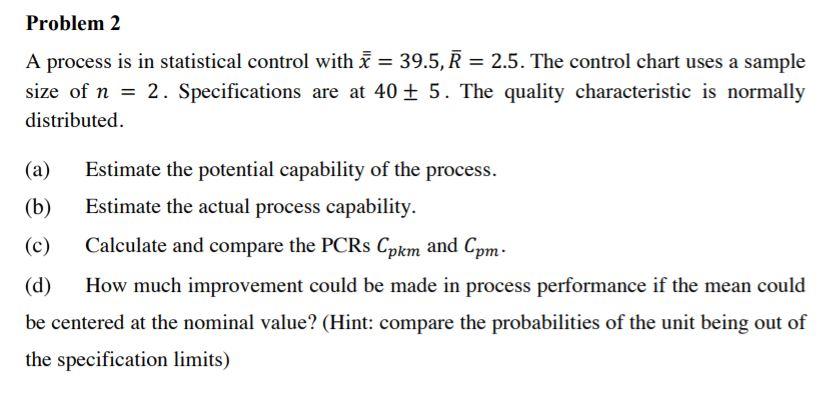
Question: = = Problem 2 A process is in statistical control with = 39.5, R = 2.5. The control chart uses a sample size of n

= = Problem 2 A process is in statistical control

= = Problem 2 A process is in statistical control with = 39.5, R = 2.5. The control chart uses a sample size of n = 2. Specifications are at 40 + 5. The quality characteristic is normally distributed. (a) Estimate the potential capability of the process. (b) Estimate the actual process capability. (c) Calculate and compare the PCRs Cpkm and Cpm. (d) How much improvement could be made in process performance if the mean could be centered at the nominal value? (Hint: compare the probabilities of the unit being out of the specification limits)

Step by Step Solution

There are 3 Steps involved in it

1 Expert Approved Answer
Step: 1 Unlock blur-text-image
Question Has Been Solved by an Expert!

Get step-by-step solutions from verified subject matter experts

Step: 2 Unlock
Step: 3 Unlock

Students Have Also Explored These Related General Management Questions!