

Question: Problem 2 Assuming a Gumbel distribution, perform a frequency analysis of the following flood data. Plot the data and the fitted distribution on the same
Problem
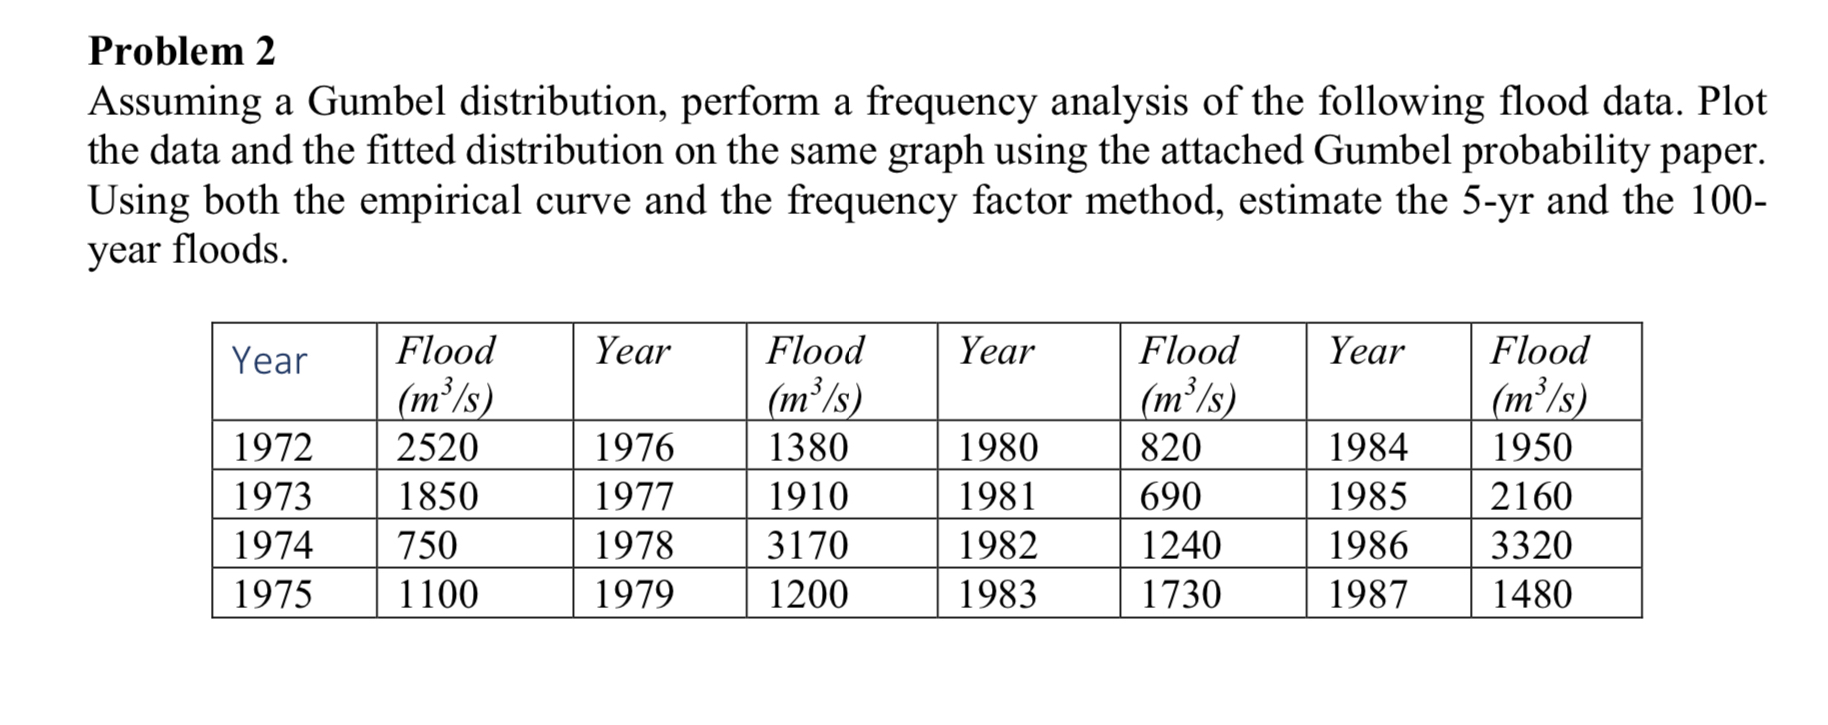
Assuming a Gumbel distribution, perform a frequency analysis of the following flood data. Plot the data and the fitted distribution on the same graph using the attached Gumbel probability paper. Using both the empirical curve and the frequency factor method, estimate the yr and the year floods.
tableYeartableFlood
Step by Step Solution
There are 3 Steps involved in it
1 Expert Approved Answer
Step: 1 Unlock

Question Has Been Solved by an Expert!
Get step-by-step solutions from verified subject matter experts
Step: 2 Unlock
Step: 3 Unlock