

Question: Problem 2: Classify Soils A through E using the Unified Soil Classification System (USCS) based on the grain size distribution and Atterberg limits information
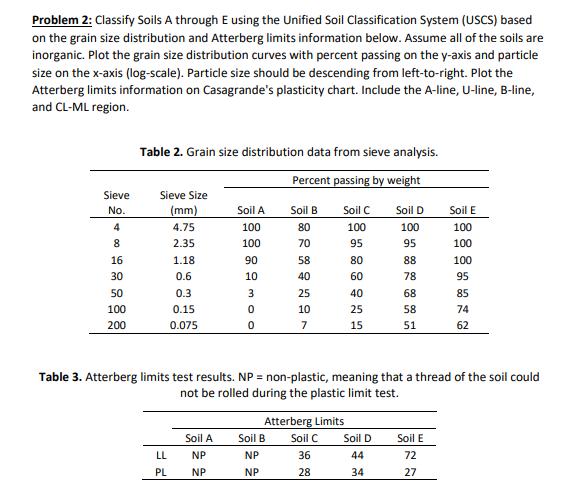
Problem 2: Classify Soils A through E using the Unified Soil Classification System (USCS) based on the grain size distribution and Atterberg limits information below. Assume all of the soils are inorganic. Plot the grain size distribution curves with percent passing on the y-axis and particle size on the x-axis (log-scale). Particle size should be descending from left-to-right. Plot the Atterberg limits information on Casagrande's plasticity chart. Include the A-line, U-line, B-line, and CL-ML region. Sieve No.. 4 8 16 30 50 100 200 Table 2. Grain size distribution data from sieve analysis. Percent passing by weight Sieve Size (mm) 4.75 2.35 1.18 0.6 0.3 LL PL 0.15 0.075 Soil A 100 100 Soil A NP NP 90 10 3 0 0 Soil B 80 70 58 40 25 10 7 Soil B NP NP Soil C 100 95 Atterberg Limits Soil C 36 28 80 60 40 25 15 Table 3. Atterberg limits test results. NP = non-plastic, meaning that a thread of the soil could not be rolled during the plastic limit test. Soil D 100 95 88 78 68 58 51 Soil D 44 34 Soil E 100 100 100 95 Soil E 72 27 85 74 62
Step by Step Solution
3.32 Rating (158 Votes )
There are 3 Steps involved in it
Answer Solution For joil A Dio DIO 06 mw D30 DGO ... View full answer

Get step-by-step solutions from verified subject matter experts