

Question: Problem 2 . Consider the following table of Call / Put premia for maturity T = 1 year: table [ [ Strike , Call
Problem Consider the following table of CallPut premia for maturity year:
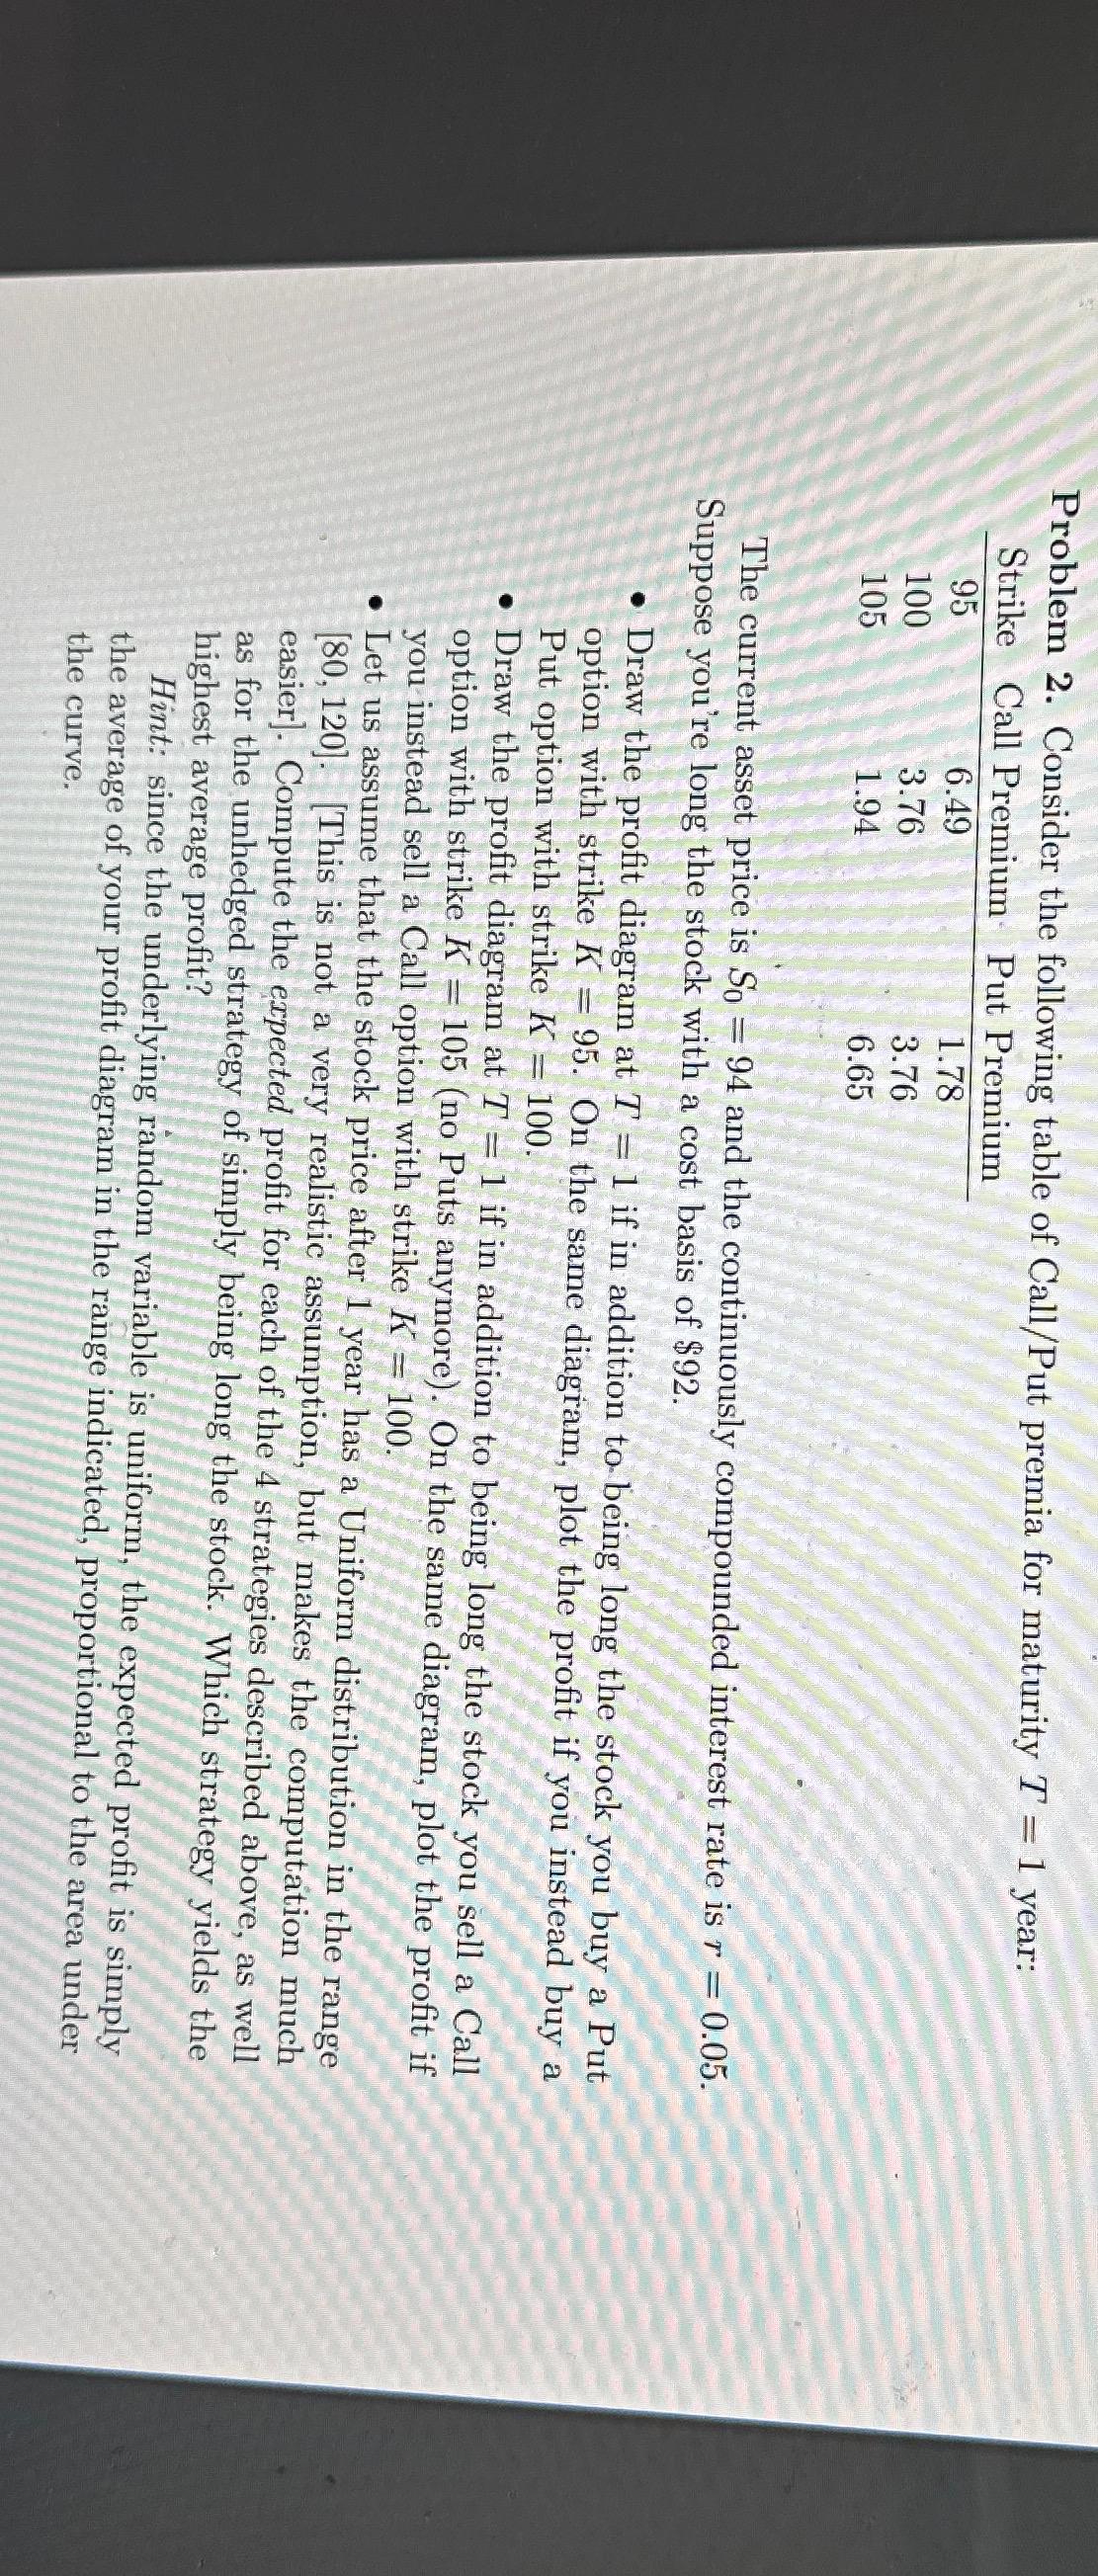
tableStrikeCall Premium,Put Premium
The current asset price is and the continuously compounded interest rate is Suppose you're long the stock with a cost basis of $
Draw the profit diagram at if in addition to being long the stock you buy a Put option with strike On the same diagram, plot the profit if you instead buy a Put option with strike
Draw the profit diagram at if in addition to being long the stock you sell a Call option with strike no Puts anymore On the same diagram, plot the profit if you instead sell a Call option with strike
Let us assume that the stock price after year has a Uniform distribution in the range This is not a very realistic assumption, but makes the computation much easier Compute the expected profit for each of the strategies described above, as well as for the unhedged strategy of simply being long the stock. Which strategy yields the highest average profit?
Hint: since the underlying random variable is uniform, the expected profit is simply the average of your profit diagram in the range indicated, proportional to the area under the curve.
Step by Step Solution
There are 3 Steps involved in it
1 Expert Approved Answer
Step: 1 Unlock

Question Has Been Solved by an Expert!
Get step-by-step solutions from verified subject matter experts
Step: 2 Unlock
Step: 3 Unlock