

Question: ## Problem 2 Consider the mtcars' data set. Use Nggplot ( ) * to make a scatterplot of mpg y - axis )
## Problem
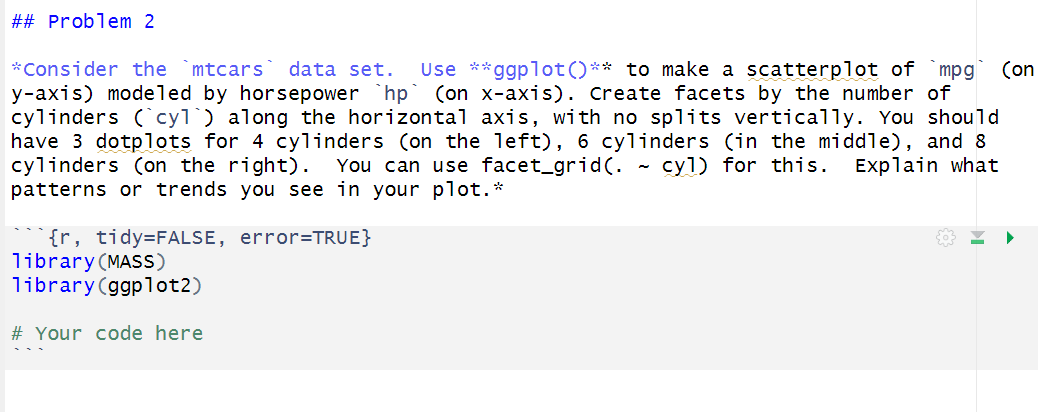
"Consider the "mtcars' data set. Use "Nggplot to make a scatterplot of mpg
yaxis modeled by horsepower hpon xaxis Create facets by the number of
cylinders along the horizontal axis, with no splits vertically. You should
have dotplots for cylinders on the left cylinders in the middle and
cylinders on the right You can use facetgrid cyl for this. Explain what
patterns or trends you see in your plot.
tidyFALSE, errorTRUE
Step by Step Solution
There are 3 Steps involved in it
1 Expert Approved Answer
Step: 1 Unlock

Question Has Been Solved by an Expert!
Get step-by-step solutions from verified subject matter experts
Step: 2 Unlock
Step: 3 Unlock