

Question: Problem 2: Cost-Volume Analysis All analysis and calculations and report must be done in a single (ONE) Excel file. Put your name at the top
Problem 2: Cost-Volume Analysis
- All analysis and calculations and report must be done in a single (ONE) Excel file.
- Put your name at the top of the worksheet.
- Make Excel do all of the calculations. . (Instructor must be able to see your cell-reference formulas.)
- Include graph interpretation below the graph. Make sure it is clear, complete, and easy to find.
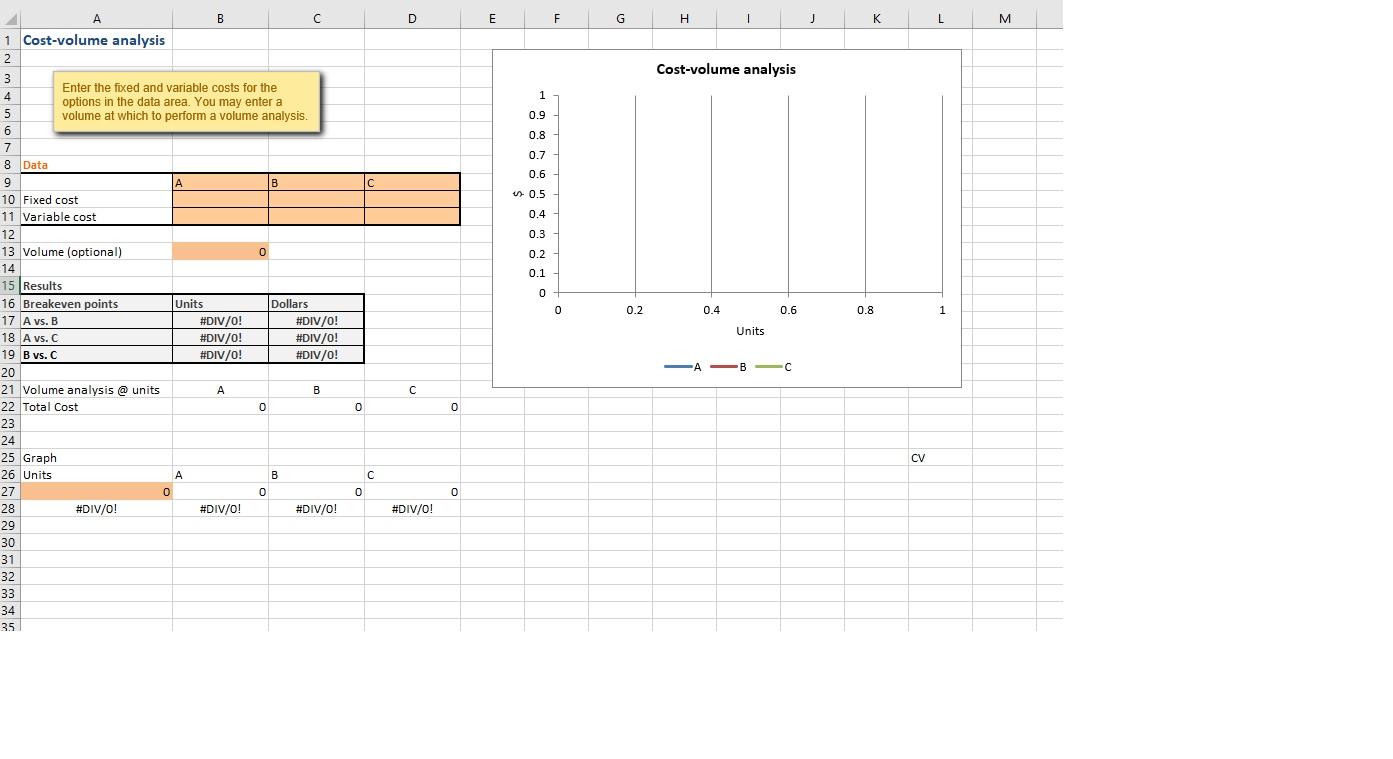
- A manager is trying to determine which of three production processes to implement to produce a component for a new product line. Process A would entail a variable cost of $17 per unit and an annual fixed cost of $150,000. Process B would entail a variable cost of $11 per unit and an annual fixed cost of $250,000. Process C would entail a variable cost of $20 per unit and an annual fixed cost of $180,000.
- Develop three separate models in your spreadsheet to calculate Total cost for each process. The models must be flexible and able to calculate Total cost for any Quantity produced.
- Create a Cost-Volume graph that shows total cost lines for all three options. (Volume should range from 0 to 30,000)
- Write an interpretation of your graph
Attached is the spreadsheet to be used:
Step by Step Solution
There are 3 Steps involved in it
1 Expert Approved Answer
Step: 1 Unlock

Question Has Been Solved by an Expert!
Get step-by-step solutions from verified subject matter experts
Step: 2 Unlock
Step: 3 Unlock