

Question: Problem 2: Create the following using the adjacent data series: Actual Sales X21 Regulator/Forecasted Sales X21/National Plumbing Wholesale of Similar X21 Category data: a) An
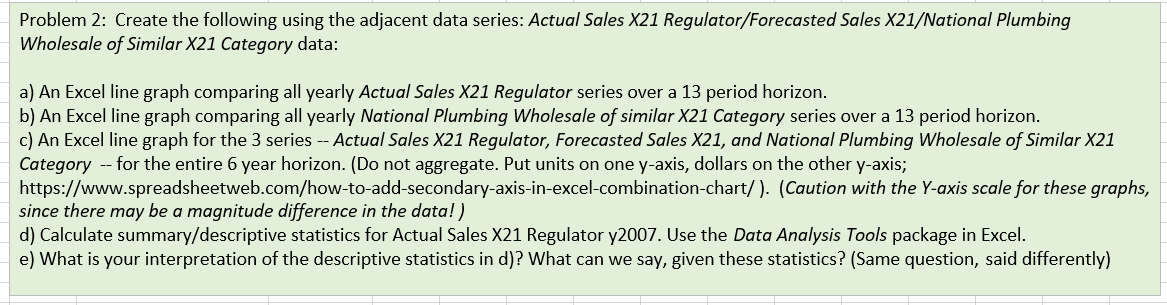
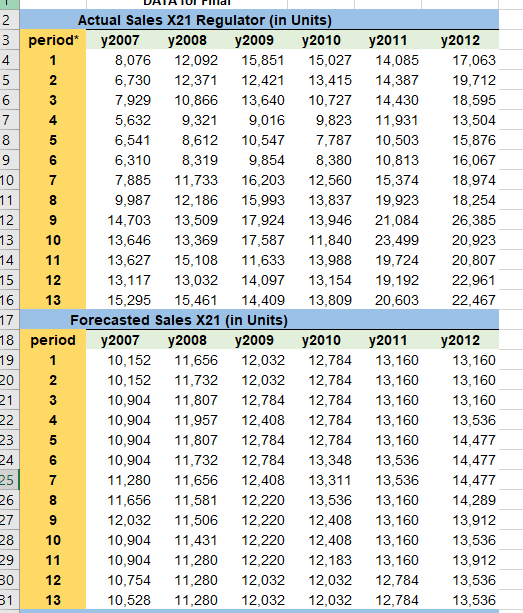
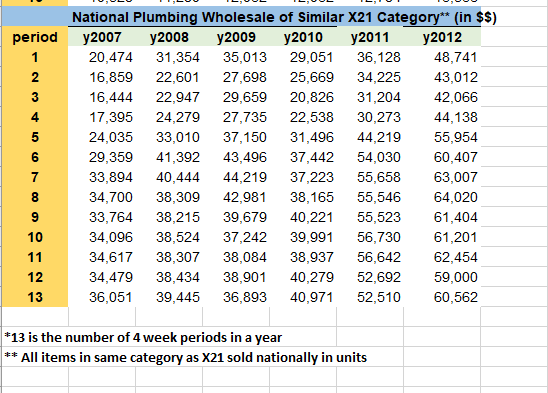
Problem 2: Create the following using the adjacent data series: Actual Sales X21 Regulator/Forecasted Sales X21/National Plumbing Wholesale of Similar X21 Category data: a) An Excel line graph comparing all yearly Actual Sales X21 Regulator series over a 13 period horizon. b) An Excel line graph comparing all yearly National Plumbing Wholesale of similar X21 Category series over a 13 period horizon. c) An Excel line graph for the 3 series -- Actual Sales X21 Regulator, Forecasted Sales X21, and National Plumbing Wholesale of Similar X21 Category -- for the entire 6 year horizon. (Do not aggregate. Put units on one y-axis, dollars on the other y-axis; https://www.spreadsheetweb.com/how-to-add-secondary-axis-in-excel-combination-chart/). (Caution with the Y-axis scale for these graphs, since there may be a magnitude difference in the data!) d) Calculate summary/descriptive statistics for Actual Sales X21 Regulator y2007. Use the Data Analysis Tools package in Excel. e) What is your interpretation of the descriptive statistics in d)? What can we say, given these statistics? (Same question, said differently) 2 Actual Sales X21 Regulator (in Units) 3 period* y2007 y2008 y2009 4 8,076 12,092 15,851 17,063 6,730 12,371 12,421 13,415 14,387 19,712 7,929 10,866 13,640 10,727 14,430 18,595 5,632 9,321 9,016 9,823 11,931 13,504 6,541 8,612 10,547 7,787 10,503 15,876 6,310 8,319 9,854 8,380 10,813 16,067 7,885 11,733 16,203 12,560 15,374 18,974 9,987 12,186 15,993 13,837 19,923 18,254 14,703 13,509 17,924 13,946 21,084 26,385 13,646 13,369 17,587 11,840 23,499 20,923 13,627 15,108 11,633 13,988 19,724 20,807 13,117 13,032 14,097 13,154 19,192 22,961 15,295 15,461 14,409 13,809 20,603 22,467 Forecasted Sales X21 (in Units) y2009 y2010 679SA WN 123 5 3 4 5 6 7 8 9 10 11 12 16 13 17 18 period y2007 y2008 19 1 10,152 11,656 20 2 10,152 11,732 21 3 10,904 11,807 22 4 10,904 11,957 23 10,904 11,807 24 10,904 11,732 11,280 11,656 11,656 11,581 12,032 11,506 10,904 11,431 10,904 11,280 10,754 10,528 8 9 10 11 12 13 14 15 2 31 01 5 6 25 7 26 8 27 9 28 10 29 11 30 12 13 y2010 y2011 15,027 14,085 y2012 y2011 y2012 12,032 12,784 13,160 12,032 12,784 13,160 12,784 12,784 13,160 12,408 12,784 13,160 12,784 12,784 13,160 12,784 13,348 13,536 12,408 13,311 13,536 12,220 13,536 13,160 12,220 12,408 13,160 12,220 12,408 13,160 12,220 12,183 13,160 11,280 12,032 12,032 12,784 11,280 12,032 12,032 12,784 13,160 13,160 13,160 13,536 14,477 14,477 14,477 14,289 13,912 13,536 13,912 13,536 13,536 National Plumbing Wholesale of Similar X21 Category** (in $$) period y2007 y2008 y2009 y2010 y2011 y2012 1 20,474 31,354 35,013 29,051 36,128 48,741 2 16,859 22,601 27,698 25,669 34,225 43,012 3 16,444 22,947 29,659 20,826 31,204 42,066 4 17,395 24,279 27,735 22,538 30,273 44,138 5 24,035 33,010 37,150 31,496 44,219 55,954 6 29,359 41,392 43,496 37,442 54,030 60,407 7 33,894 40,444 44,219 37,223 55,658 63,007 8 34,700 38,309 42,981 38,165 55,546 64,020 9 33,764 38,215 39,679 40,221 55,523 61,404 10 34,096 38,524 37,242 39,991 56,730 61,201 11 34,617 38,307 38,084 38,937 56,642 62,454 12 34,479 38,434 38,901 40,279 52,692 59,000 13 36,051 39,445 36,893 40,971 52,510 60,562 *13 is the number of 4 week periods in a year ** All items in same category as X21 sold nationally in units Problem 2: Create the following using the adjacent data series: Actual Sales X21 Regulator/Forecasted Sales X21/National Plumbing Wholesale of Similar X21 Category data: a) An Excel line graph comparing all yearly Actual Sales X21 Regulator series over a 13 period horizon. b) An Excel line graph comparing all yearly National Plumbing Wholesale of similar X21 Category series over a 13 period horizon. c) An Excel line graph for the 3 series -- Actual Sales X21 Regulator, Forecasted Sales X21, and National Plumbing Wholesale of Similar X21 Category -- for the entire 6 year horizon. (Do not aggregate. Put units on one y-axis, dollars on the other y-axis; https://www.spreadsheetweb.com/how-to-add-secondary-axis-in-excel-combination-chart/). (Caution with the Y-axis scale for these graphs, since there may be a magnitude difference in the data!) d) Calculate summary/descriptive statistics for Actual Sales X21 Regulator y2007. Use the Data Analysis Tools package in Excel. e) What is your interpretation of the descriptive statistics in d)? What can we say, given these statistics? (Same question, said differently) 2 Actual Sales X21 Regulator (in Units) 3 period* y2007 y2008 y2009 4 8,076 12,092 15,851 17,063 6,730 12,371 12,421 13,415 14,387 19,712 7,929 10,866 13,640 10,727 14,430 18,595 5,632 9,321 9,016 9,823 11,931 13,504 6,541 8,612 10,547 7,787 10,503 15,876 6,310 8,319 9,854 8,380 10,813 16,067 7,885 11,733 16,203 12,560 15,374 18,974 9,987 12,186 15,993 13,837 19,923 18,254 14,703 13,509 17,924 13,946 21,084 26,385 13,646 13,369 17,587 11,840 23,499 20,923 13,627 15,108 11,633 13,988 19,724 20,807 13,117 13,032 14,097 13,154 19,192 22,961 15,295 15,461 14,409 13,809 20,603 22,467 Forecasted Sales X21 (in Units) y2009 y2010 679SA WN 123 5 3 4 5 6 7 8 9 10 11 12 16 13 17 18 period y2007 y2008 19 1 10,152 11,656 20 2 10,152 11,732 21 3 10,904 11,807 22 4 10,904 11,957 23 10,904 11,807 24 10,904 11,732 11,280 11,656 11,656 11,581 12,032 11,506 10,904 11,431 10,904 11,280 10,754 10,528 8 9 10 11 12 13 14 15 2 31 01 5 6 25 7 26 8 27 9 28 10 29 11 30 12 13 y2010 y2011 15,027 14,085 y2012 y2011 y2012 12,032 12,784 13,160 12,032 12,784 13,160 12,784 12,784 13,160 12,408 12,784 13,160 12,784 12,784 13,160 12,784 13,348 13,536 12,408 13,311 13,536 12,220 13,536 13,160 12,220 12,408 13,160 12,220 12,408 13,160 12,220 12,183 13,160 11,280 12,032 12,032 12,784 11,280 12,032 12,032 12,784 13,160 13,160 13,160 13,536 14,477 14,477 14,477 14,289 13,912 13,536 13,912 13,536 13,536 National Plumbing Wholesale of Similar X21 Category** (in $$) period y2007 y2008 y2009 y2010 y2011 y2012 1 20,474 31,354 35,013 29,051 36,128 48,741 2 16,859 22,601 27,698 25,669 34,225 43,012 3 16,444 22,947 29,659 20,826 31,204 42,066 4 17,395 24,279 27,735 22,538 30,273 44,138 5 24,035 33,010 37,150 31,496 44,219 55,954 6 29,359 41,392 43,496 37,442 54,030 60,407 7 33,894 40,444 44,219 37,223 55,658 63,007 8 34,700 38,309 42,981 38,165 55,546 64,020 9 33,764 38,215 39,679 40,221 55,523 61,404 10 34,096 38,524 37,242 39,991 56,730 61,201 11 34,617 38,307 38,084 38,937 56,642 62,454 12 34,479 38,434 38,901 40,279 52,692 59,000 13 36,051 39,445 36,893 40,971 52,510 60,562 *13 is the number of 4 week periods in a year ** All items in same category as X21 sold nationally in units
Step by Step Solution
There are 3 Steps involved in it

Get step-by-step solutions from verified subject matter experts