

Question: Problem 2: Every week in Marion Nursing Home (MNH) some residents need to visit their medical centers for various reasons. Due to the age of
Problem 2:
Every week in Marion Nursing Home (MNH) some residents need to visit their medical centers for various reasons. Due to the age of the residents, the nurses in MNH always check if the resident complains about high blood pressure (BP) and needs special attention. The managers in MNH wonder if the percentage of visiting residents complaining about high BP shows wide variations since it varies a lot.They wonder if external reasons caused such high variations and would like to construct SPC p-chart to get some insights.
Please construct an p Chart for MNH in the last 15 weeks, which you should provide answers for the following questions:
a) Based on your answers for part b), conclude on whether the percentage of visiting residents to the medical center is in control.
b) Construct a 15-week run chart for p-chart, in which the weekly data points, the upper and lower control limits should be shown.
c) Please provide chart title and label the legend properly
DATA LISTED BELOW
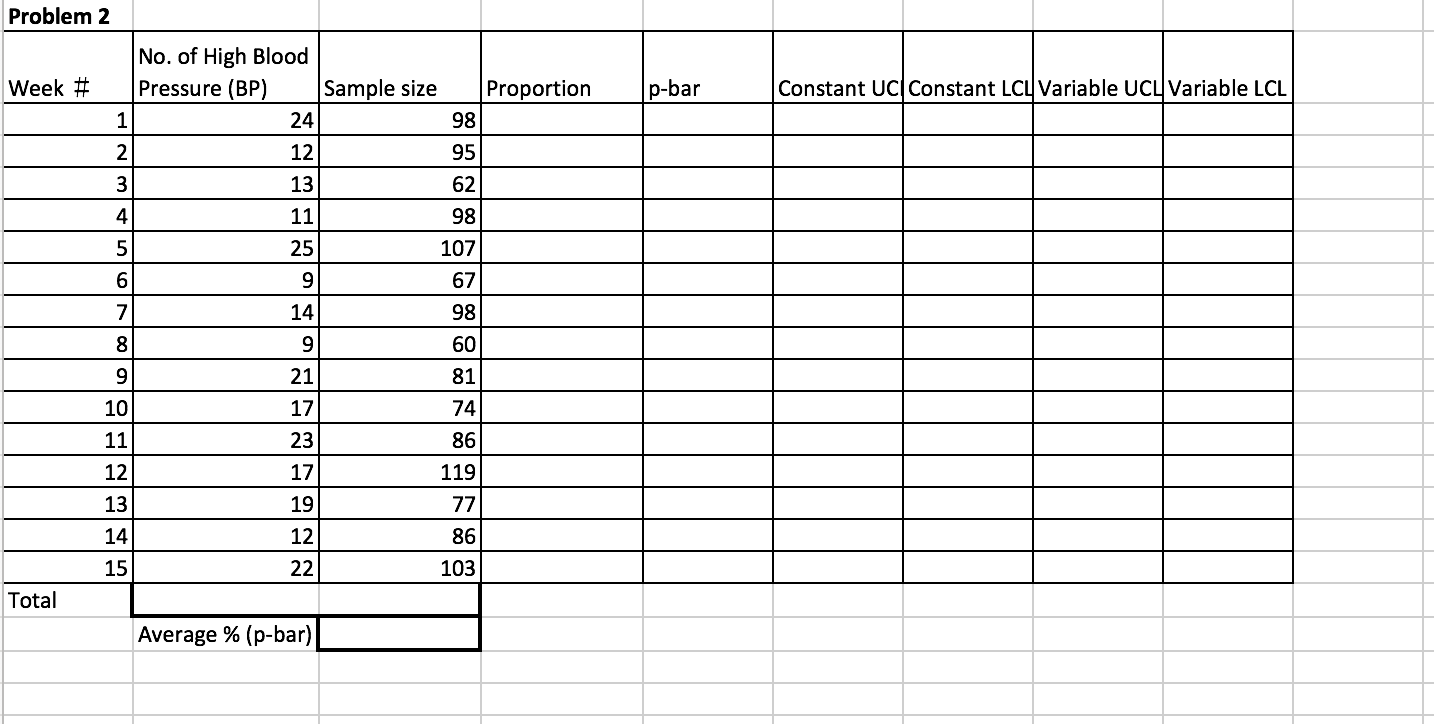
Problem 2 No. of High Blood Week # Pressure (BP) Sample size Proportion p-bar Constant UC Constant LCL Variable UCL Variable LCL 24 98 2 12 95 13 62 4 11 98 5 25 107 6 9 67 14 98 8 9 60 9 21 81 10 17 74 11 23 86 12 17 119 13 19 77 14 12 86 15 22 103 Total Average % (p-bar)
Step by Step Solution
There are 3 Steps involved in it

Get step-by-step solutions from verified subject matter experts