

Question: Problem 2: Examine the oil acquisition costs data set again. Use PROC PLOT to plot: a) domestic vs date, without any other options b) imported
Problem 2: Examine the oil acquisition costs data set again. Use PROC PLOT to plot:
a) domestic vs date, without any other options
b) imported vs date, with the character '%' as the indicator
c) domestic vs date, and import vs date separately but on the same page.
Include the SAS code and output file.
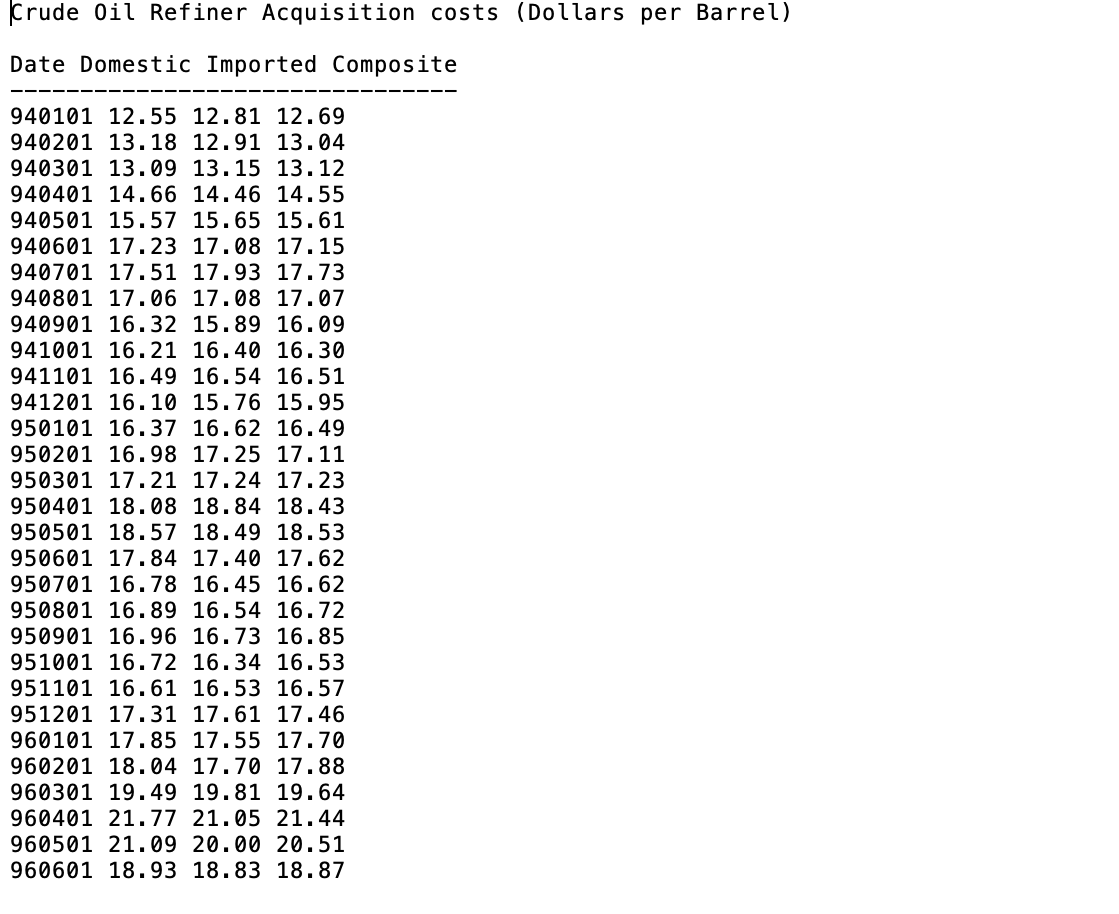
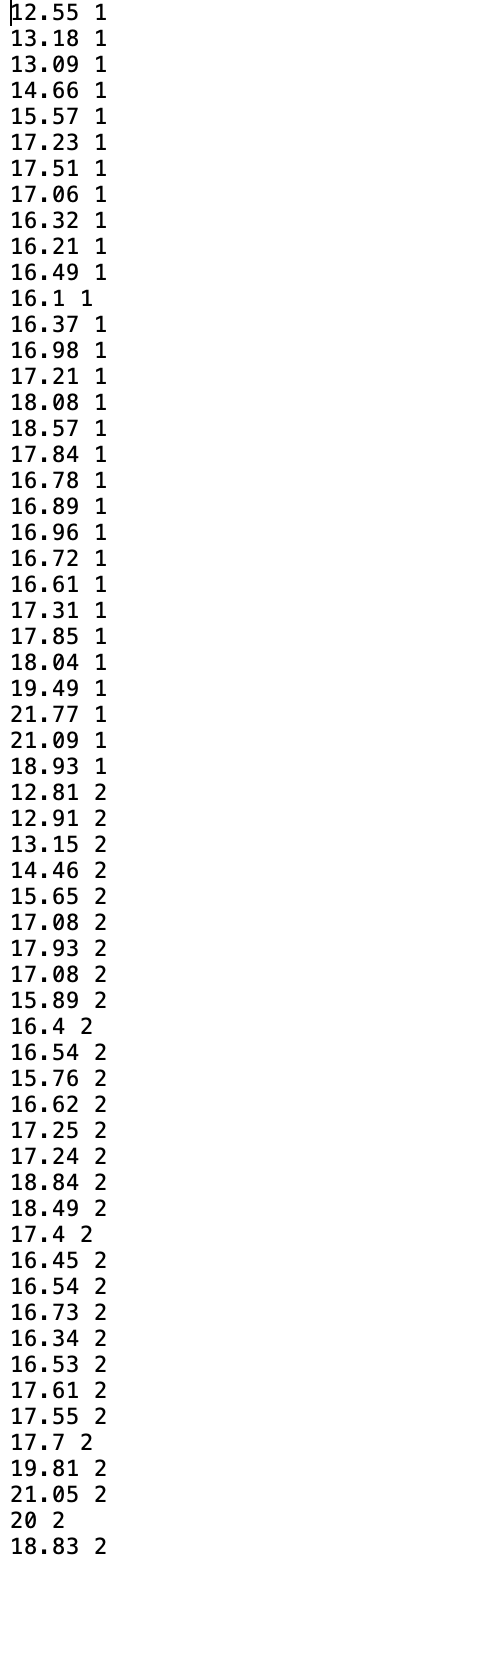
Crude Oil Refiner Acquisition costs (Dollars per Barrel) Date Domestic Imported Composite 940101 12.55 12.81 12.69 940201 13.18 12.91 13.04 940301 13.09 13.15 13.12 940401 14.66 14.46 14.55 940501 15.57 15.65 15.61 940601 17.23 17.08 17.15 940701 17.51 17.93 17.73 940801 17.06 17.08 17.07 940901 16.32 15.89 16.09 941001 16.21 16.40 16.30 941101 16.49 16.54 16.51 941201 16.10 15.76 15.95 950101 16.37 16.62 16.49 950201 16.98 17.25 17.11 950301 17.21 17.24 17.23 950401 18.08 18.84 18.43 950501 18.57 18.49 18.53 950601 17.84 17.40 17.62 950701 16.78 16.45 16.62 950801 16.89 16.54 16.72 950901 16.96 16.73 16.85 951001 16.72 16.34 16.53 951101 16.61 16.53 16.57 951201 17.31 17.61 17.46 960101 17.85 17.55 17.70 960201 18.04 17.70 17.88 960301 19.49 19.81 19.64 960401 21.77 21.05 21.44 960501 21.09 20.00 20.51 960601 18.93 18.83 18.87 12.55 1 13.18 1 13.09 1 14.66 1 15.57 1 17.23 1 17.51 1 17.06 1 16.32 1 16.21 1 16.49 1 16.1 1 16.37 1 16.98 1 17.21 1 18.08 1 18.57 1 17.84 1 16.78 1 16.89 1 16.96 1 16.72 1 16.61 1 17.31 1 17.85 1 18.04 1 19.49 1 21.77 1 21.09 1 18.93 1 12.81 2 12.91 2 13.15 2 14.46 2 15.65 2 17.08 2 17.93 2 17.08 2 15.89 2 16.4 2 16.54 2 15.76 2 16.62 2 17.25 2 17.24 2 18.84 2 18.49 2 17.4 2 16.45 2 16.54 16.73 2 16.34 2 16.53 2. 17.61 2 17.55 2 17.7 2 19.81 2 21.05 2 20 2 18.83 2
Step by Step Solution
There are 3 Steps involved in it

Get step-by-step solutions from verified subject matter experts