

Question: Problem #2, f. Draw a boxplot of the data set. Use a scale that starts at 20, ends at 70, and goes by increments of
Problem #2,
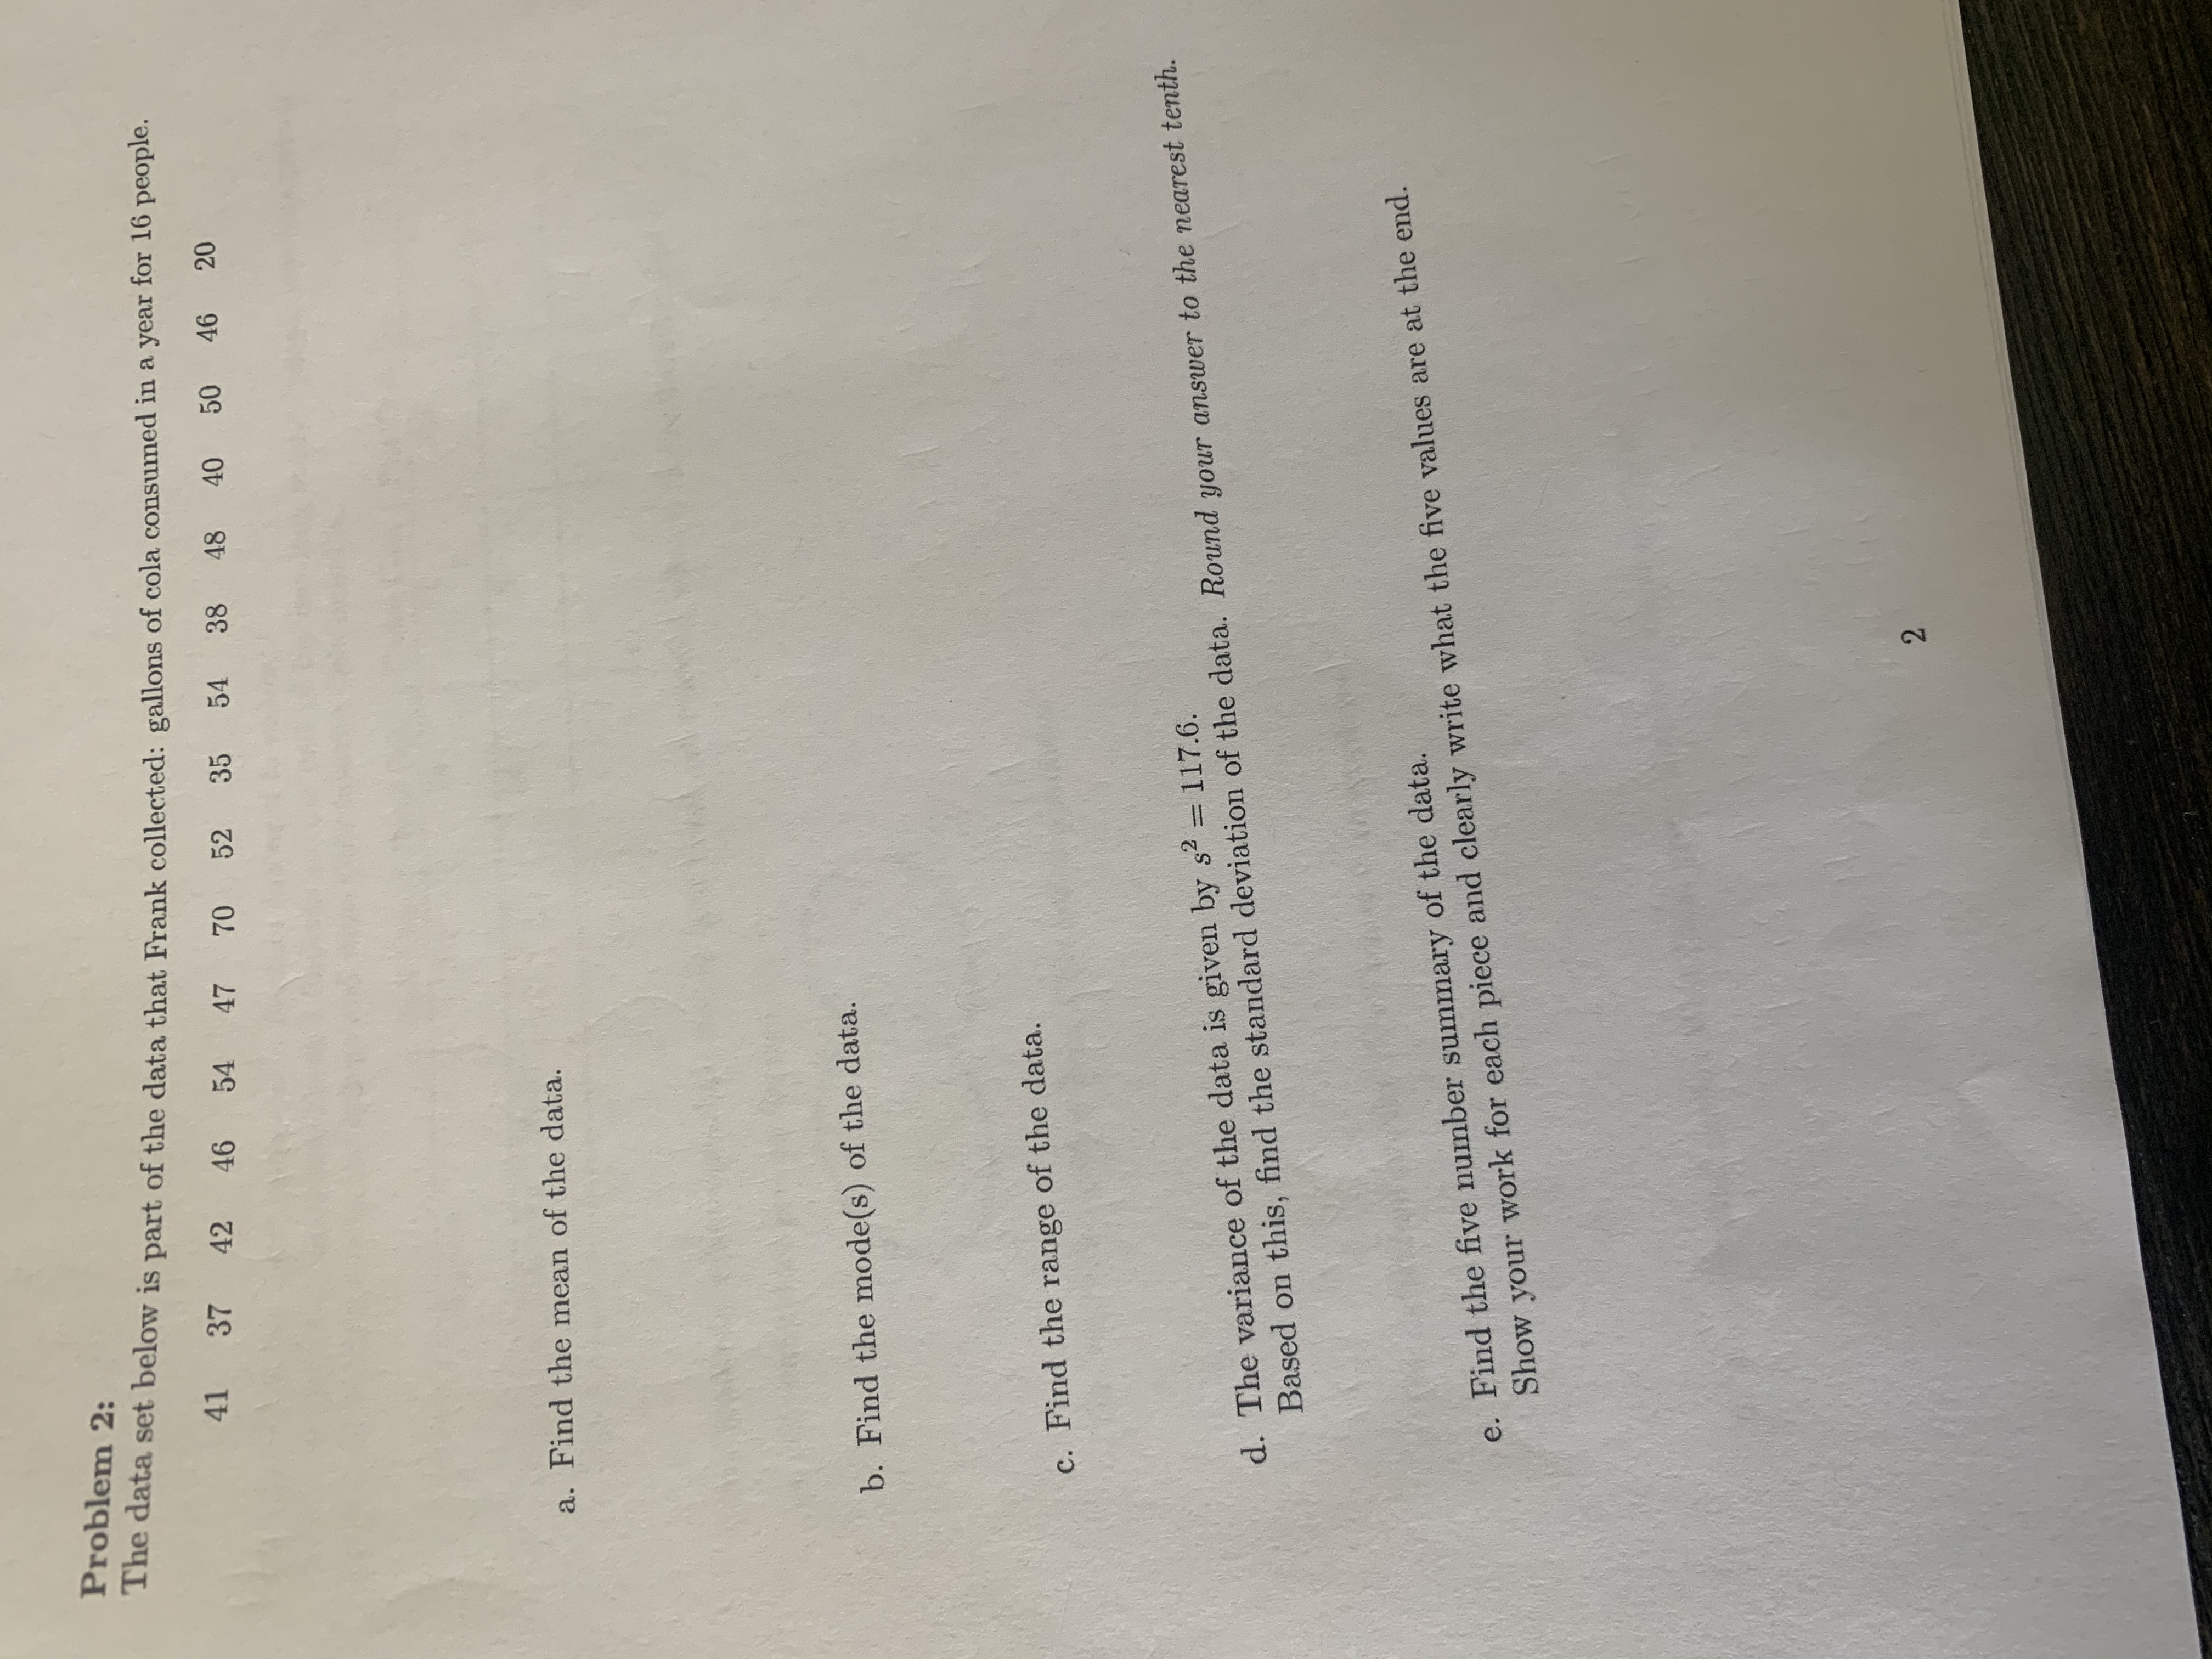
f. Draw a boxplot of the data set. Use a scale that starts at 20, ends at 70, and goes by increments of 5. Start by finding the IQR, the lower fence, and the upper fence.Problem 2: The data set below is part of the data that Frank collected: gallons of cola consumed in a year for 16 people. 41 37 42 46 54 47 70 52 35 54 38 48 40 504 20 a. Find the mean of the data. b. Find the mode(s) of the data. c. Find the range of the data. d. The variance of the data is given by s2 = 117.6. Based on this, find the standard deviation of the data. Round your answer to the nearest tenth. e. Find the five number summary of the data. Show your work for each piece and clearly write what the five values are at the end. 2
Step by Step Solution
There are 3 Steps involved in it

Get step-by-step solutions from verified subject matter experts