

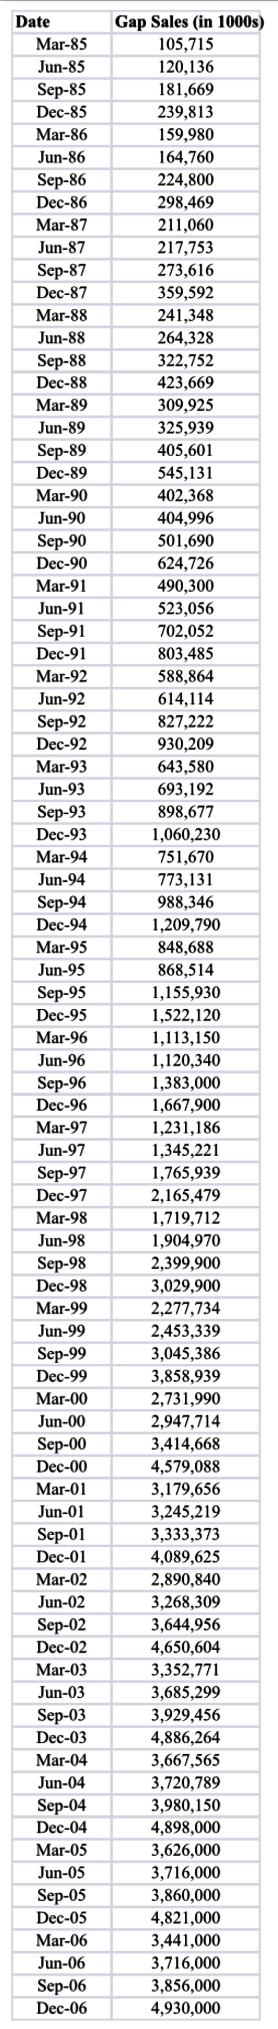
Question: Problem 2 : Gap Sales Table 2 presents the Gap's quarterly sales data for 1 9 8 5 Q 1 through 2 0 0 6
Problem : Gap Sales
Table presents the Gap's quarterly sales data for Q
through Q Analyze the data and answer the following
questions:
Create a timeseries plot of the Gap Sales. Describe the
patterns of the time series you see in the graph.
Calculate the seasonal factors SI and then the seasonal
indices S based on the Q Q data. Are they
consistent with your expectations? Explain in detail.
Step by Step Solution
There are 3 Steps involved in it
1 Expert Approved Answer
Step: 1 Unlock

Question Has Been Solved by an Expert!
Get step-by-step solutions from verified subject matter experts
Step: 2 Unlock
Step: 3 Unlock