

Question: Problem 2 : Given a concerned area that has 5 0 0 households. The trip generation related curves are obtained as the follow figures. If
Problem : Given a concerned area that has households. The trip generation related curves are
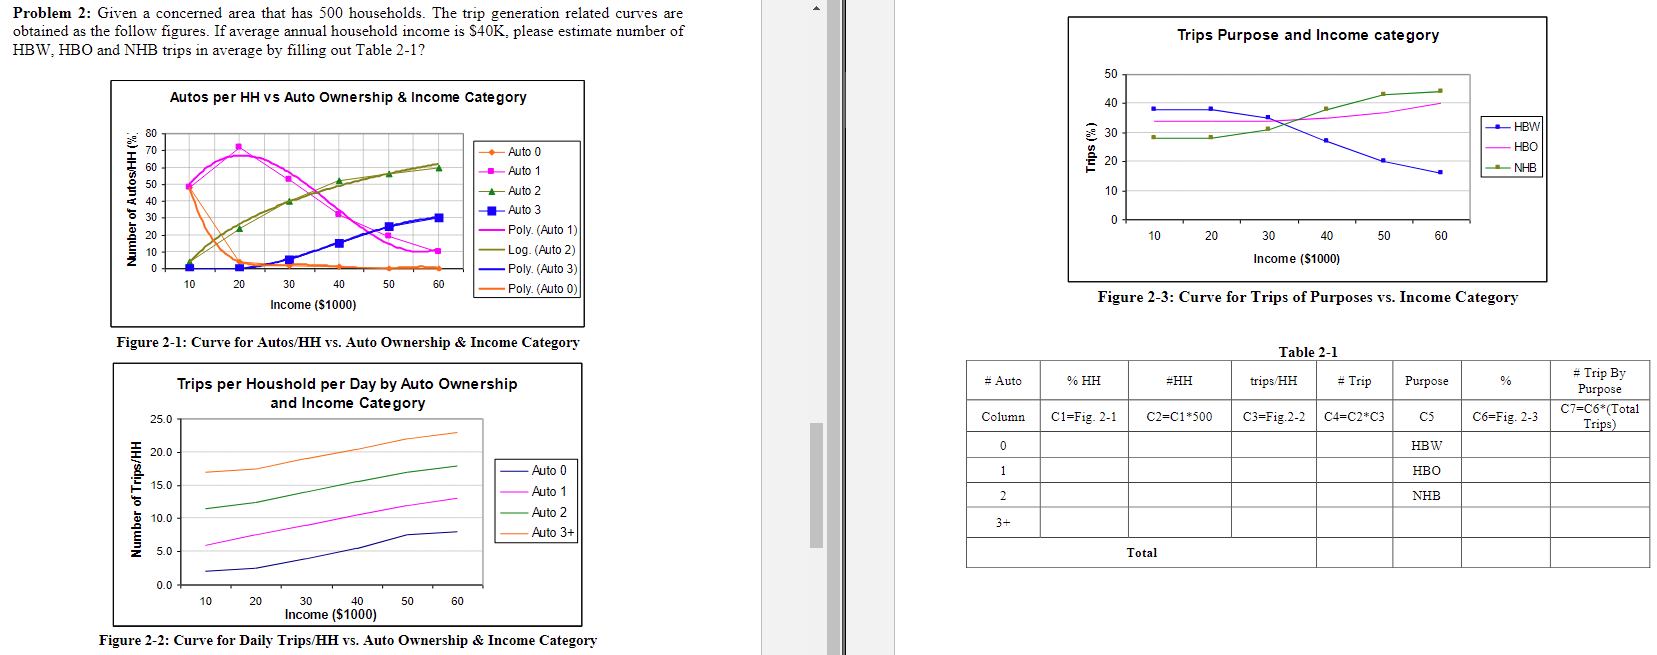
obtained as the follow figures. If average annual household income is $ please estimate number of
HBW HBO and NHB trips in average by filling out Table
Figure : Curve for AutosHH vs Auto Ownership & Income Category
Trips per Houshold per Day by Auto Ownership
and Income Cate gory
Figure : Curve for Daily TripsHH vs Auto Ownership & Income Category
Trips Purpose and Income category
Figure : Curve for Trips of Purposes vs Income Category
Table
Step by Step Solution
There are 3 Steps involved in it
1 Expert Approved Answer
Step: 1 Unlock

Question Has Been Solved by an Expert!
Get step-by-step solutions from verified subject matter experts
Step: 2 Unlock
Step: 3 Unlock