

Question: Problem #2: Horizontal and Vertica!Analysis Selected comparative financial statement information of the Bluegrass Corporation is provided as follows: 2 points per calculation) BLUEGRASS CORPORATION Comparative
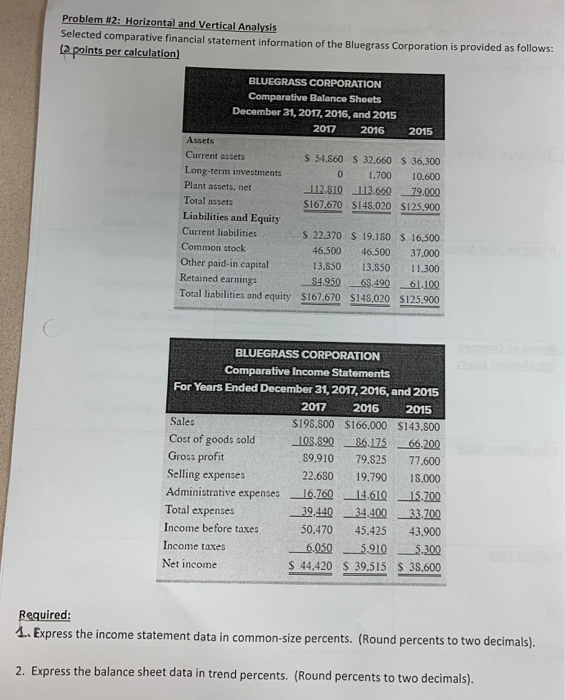
Problem #2: Horizontal and Vertica!Analysis Selected comparative financial statement information of the Bluegrass Corporation is provided as follows: 2 points per calculation) BLUEGRASS CORPORATION Comparative Balance Sheets December 31, 2017, 2016, and 2015 20172016 2015 Assets Current assets Long-term investments Plant assets, net Total assets Liabilities and Equity Current liabilities Common stock s 54.860 S 32.660 S 36,300 0 1,700 10.600 -112.810 113660 79.000 $167.670 $145.020 $125,900 S 22.370 S 19.180 s 16,500 46.500 46,500 37.000 13.850 13.850 11,300 S4.950 68490 61.100 $125.900 Other paid-in capital Retained earnings Total liabilities and equity $148.020 $167.670 BLUEGRASS CORPORATION Comparative Income Statements For Years Ended December 31, 2017,2016, and 2015 2017 20162015 S198.800 $166.000 S143.800 Sales Cost of goods cold 105.90 8617566200 S9.910 79.825 77.600 22.680 19,790 18,000 Gross profit Selling expenses Administrative expenses 16601461015.0 39.440 34400 3.00 50.470 45.425 43.900 6.0505.9105.300 $ 44.420 S 39,515 $ 38,600 Total expenses Income before taxes Income taxes Net income Required: Express the income statement data in common-size percents. (Round percents to two decimals). 2. Express the balance sheet data in trend percents. (Round percents to two decimals)
Step by Step Solution
There are 3 Steps involved in it

Get step-by-step solutions from verified subject matter experts