

Question: Problem 2. Impulse graph. This is a graph of the x-component of a force on an object. The functional form of the red curve
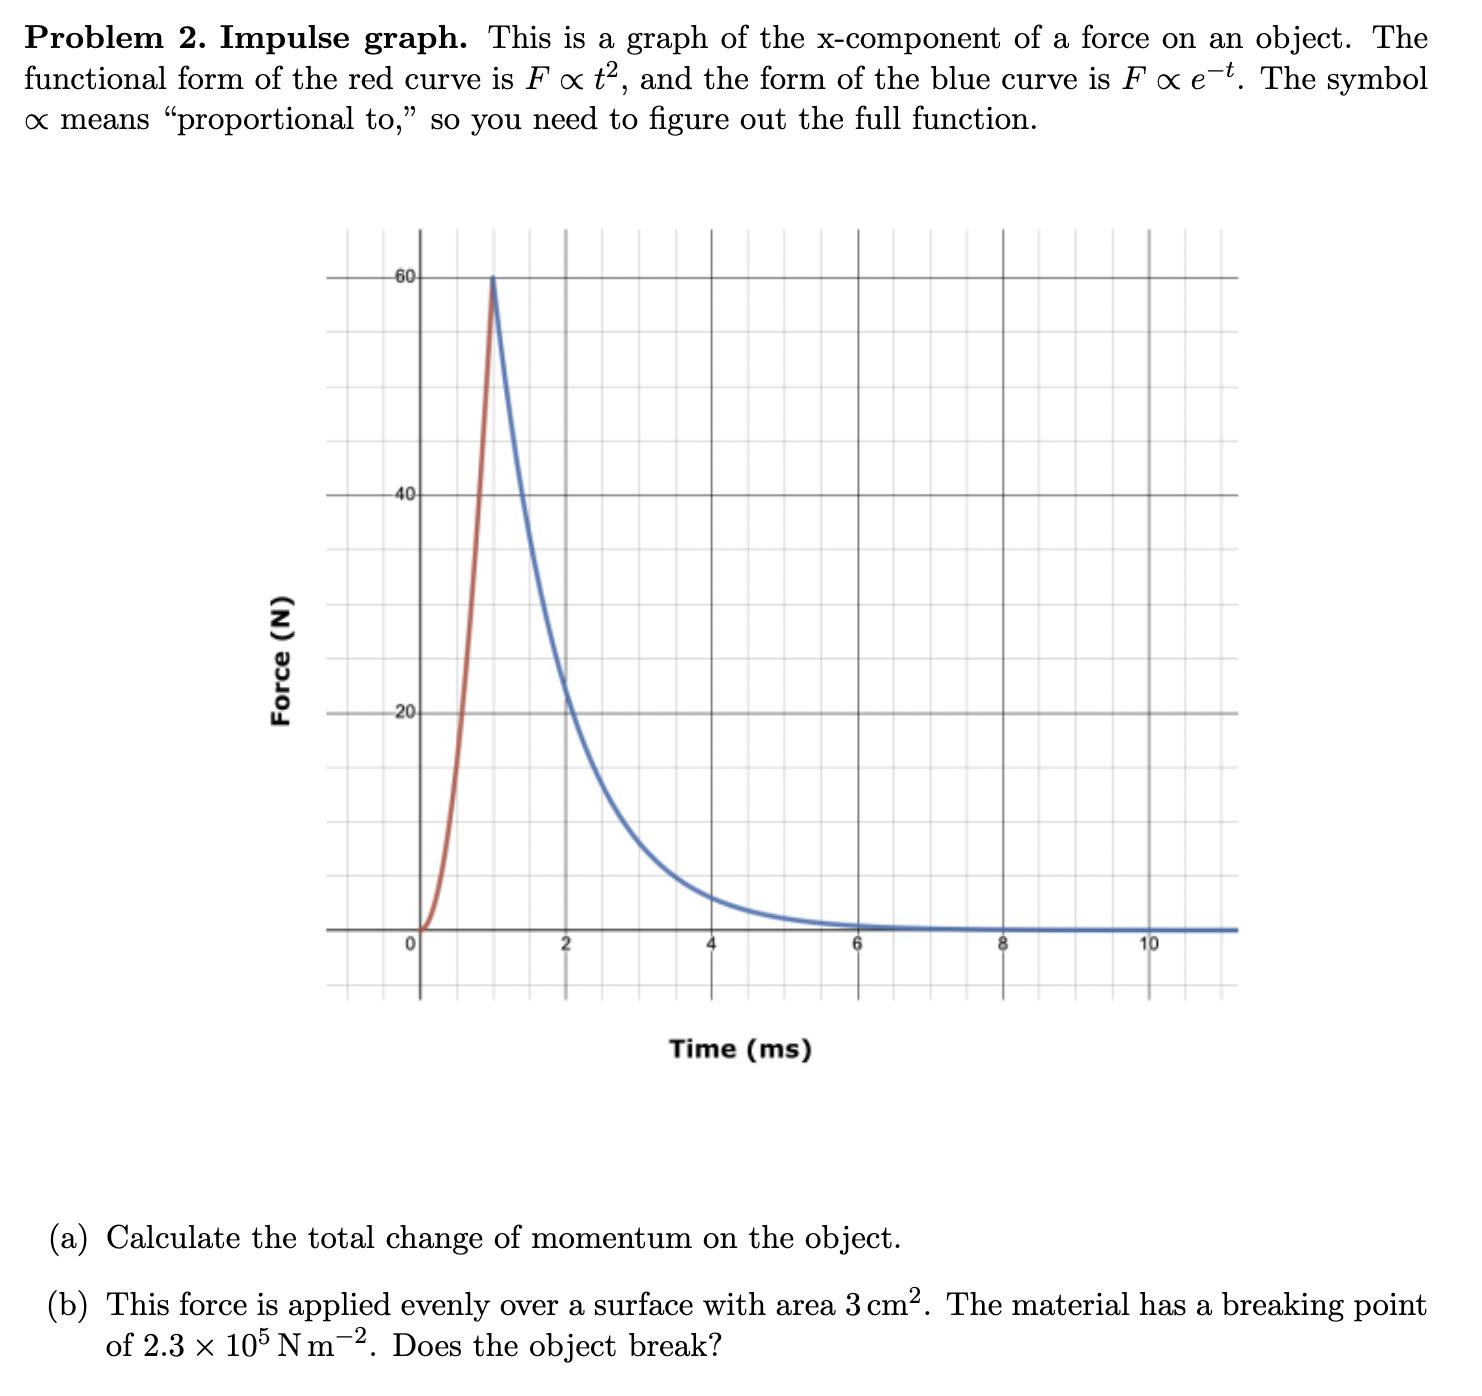
Problem 2. Impulse graph. This is a graph of the x-component of a force on an object. The functional form of the red curve is F x t, and the form of the blue curve is F xx et. The symbol x means "proportional to," so you need to figure out the full function. Force (N) 20 40 60 0 2 Time (ms) 8 10 (a) Calculate the total change of momentum on the object. (b) This force is applied evenly over a surface with area 3 cm. The material has a breaking point of 2.3 105 Nm-2. Does the object break?
Step by Step Solution
There are 3 Steps involved in it
1 Expert Approved Answer
Step: 1 Unlock

Question Has Been Solved by an Expert!
Get step-by-step solutions from verified subject matter experts
Step: 2 Unlock
Step: 3 Unlock