

Question: Problem #2 In assignment 6 you will practice scatterplots, boxplots, and density plots. You will change the printing symbols, the color of the printing symbols,
Problem #2
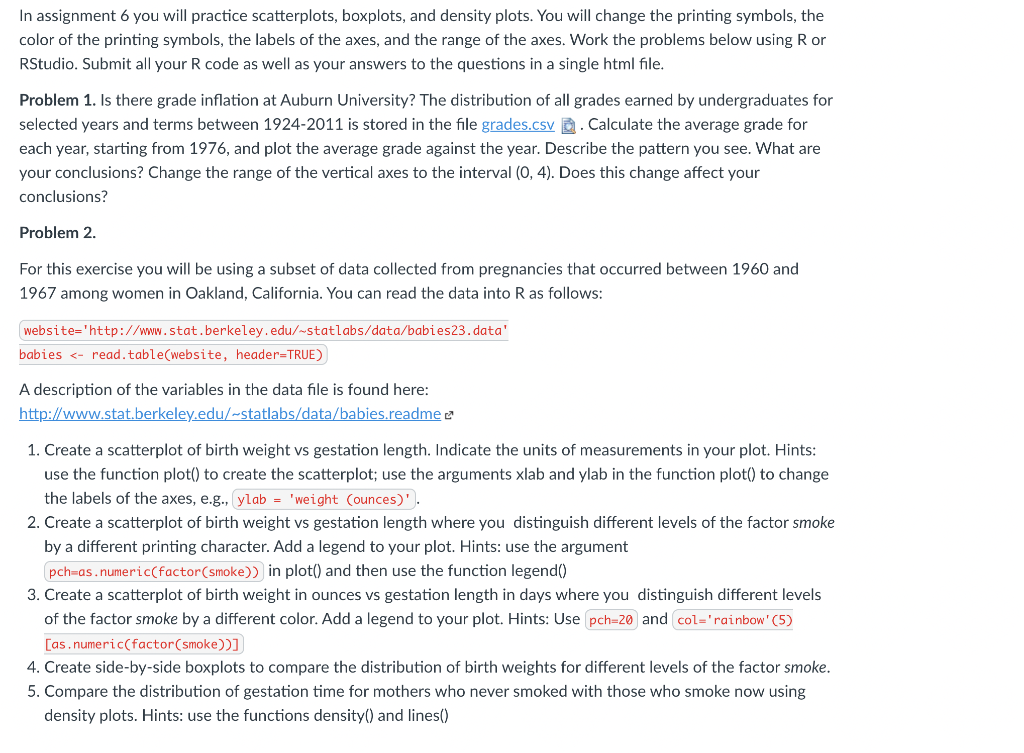
In assignment 6 you will practice scatterplots, boxplots, and density plots. You will change the printing symbols, the color of the printing symbols, the labels of the axes, and the range of the axes. Work the problems below using Ror RStudio. Submit all your R code as well as your answers to the questions in a single html file. Problem 1. Is there grade inflation at Auburn University? The distribution of all grades earned by undergraduates for selected years and terms between 1924-2011 is stored in the file grades.csv 2. Calculate the average grade for each year, starting from 1976, and plot the average grade against the year. Describe the pattern you see. What are your conclusions? Change the range of the vertical axes to the interval (0,4). Does this change affect your conclusions? Problem 2. For this exercise you will be using a subset of data collected from pregnancies that occurred between 1960 and 1967 among women in Oakland, California. You can read the data into R as follows: website='http://www.stat.berkeley.edu/-statlabs/data/babies23. data' babies
Step by Step Solution
There are 3 Steps involved in it

Get step-by-step solutions from verified subject matter experts