

Question: Problem 2 In this problem you are going to work with some real-world data. File mfunds_data.xlsx contains historical returns of three mutual funds Ticker Fund
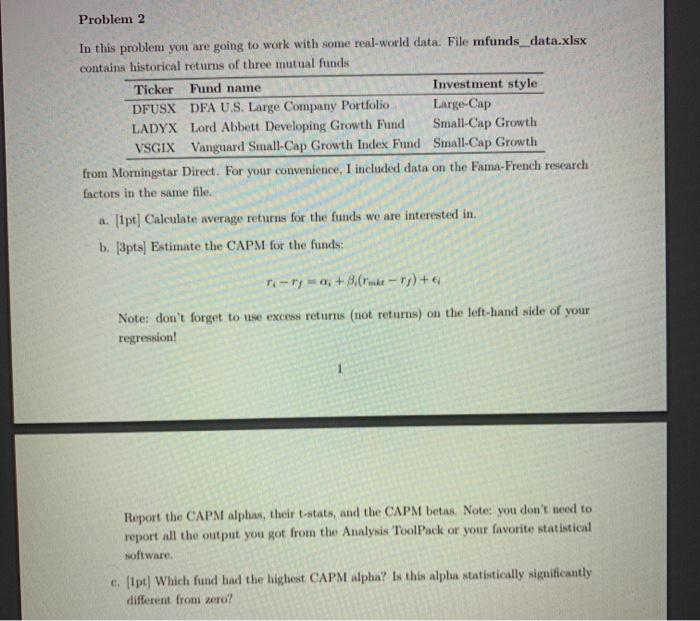
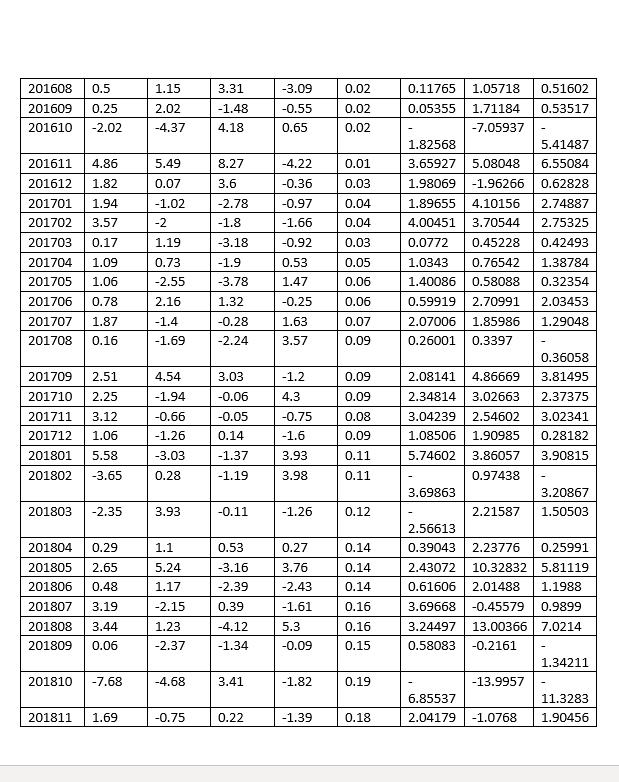
Problem 2 In this problem you are going to work with some real-world data. File mfunds_data.xlsx contains historical returns of three mutual funds Ticker Fund name Investment style DFUSX DFA U.S. Large Company Portfolio Large-Cap LADYX Lord Abbett Developing Growth Fund Small Cap Growth VSGIX Vanguard Small Cap Growth Index Fund Small Cap Growth from Morningstar Direct. For your convenience, I included data on the Fama-French research factors in the same file a. (1pt] Calculate average returns for the funds we are interested in b. [3pts) Estimate the CAPM for the funds: ni-r+B (re - y) + Note: don't forget to use excess returns (not returns) on the left-hand side of your regression! Report the CAPM alphus, their t-stats, and the CAPM betas. Note: you don't need to report all the output you got from the Analysis ToolPack or your favorite statistical software e [ipt) Which fund had the highest CAPM alpha? Is this alpha statistically significantly different from zero? -3.09 201608 201609 201610 0.5 0.25 1.15 2.02 -4.37 3.31 -1.48 4.18 0.02 0.02 0.11765 0.05355 1.05718 1.71184 -7.05937 0.51602 0.53517 -0.55 0.65 -2.02 0.02 1.82568 3.65927 5.41487 6.55084 4.86 5.49 8.27 -4.22 0.01 5.08048 -1.96266 1.82 0.07 3.6 0.03 0.62828 201611 201612 201701 201702 -0.36 -0.97 0.04 4.10156 1.94 3.57 0.17 -1.02 -2 -2.78 -1.8 -3.18 -1.9 -3.78 -1.66 -0.92 0.53 1.19 0.73 -2.55 2.16 1.09 1.98069 1.89655 4.00451 0.0772 1.0343 1.40086 0.59919 201703 201704 201705 201706 201707 201708 2.74887 2.75325 0.42493 1.38784 0.32354 1.06 0.04 0.03 0.05 0.06 0.06 0.07 0.09 3.70544 0.45228 0.76542 0.58088 2.70991 1.85986 0.3397 1.47 -0.25 1.63 3.57 0.78 1.32 2.03453 1.29048 -1.4 -0.28 2.07006 1.87 0.16 -1.69 -2.24 0.26001 0.36058 3.03 -1.2 0.09 2.08141 3.81495 4.54 -1.94 4.3 2.34814 2.51 2.25 3.12 1.06 0.09 0.08 -0.66 -0.75 201709 201710 201711 201712 201801 201802 3.04239 4.86669 3.02663 2.54602 1.90985 3.86057 -0.06 -0.05 0.14 -1.37 -1.19 2.37375 3.02341 0.28182 -1.26 -1.6 0.09 1.08506 5.58 -3.03 3.93 0.11 5.74602 3.90815 -3.65 0.28 3.98 0.11 0.97438 3.69863 3.20867 1.50503 201803 -2.35 3.93 -0.11 -1.26 0.12 2.21587 0.29 1.1 0.53 0.14 201804 201805 201806 2.56613 0.39043 2.43072 2.65 0.48 0.14 0.27 3.76 -2.43 5.24 1.17 -3.16 -2.39 0.25991 5.81119 1.1988 0.14 0.61606 2.23776 10.32832 2.01488 -0.45579 13.00366 -0.2161 -2.15 0.39 -1.61 0.16 3.69668 0.9899 201807 201808 201809 3.19 3.44 0.06 -4.12 5.3 7.0214 1.23 -2.37 0.16 0.15 3.24497 0.58083 -1.34 -0.09 1.34211 201810 -7.68 -4.68 3.41 -1.82 0.19 -13.9957 6.85537 2.04179 11.3283 1.90456 201811 1.69 -0.75 0.22 -1.39 0.18 -1.0768 Problem 2 In this problem you are going to work with some real-world data. File mfunds_data.xlsx contains historical returns of three mutual funds Ticker Fund name Investment style DFUSX DFA U.S. Large Company Portfolio Large-Cap LADYX Lord Abbett Developing Growth Fund Small Cap Growth VSGIX Vanguard Small Cap Growth Index Fund Small Cap Growth from Morningstar Direct. For your convenience, I included data on the Fama-French research factors in the same file a. (1pt] Calculate average returns for the funds we are interested in b. [3pts) Estimate the CAPM for the funds: ni-r+B (re - y) + Note: don't forget to use excess returns (not returns) on the left-hand side of your regression! Report the CAPM alphus, their t-stats, and the CAPM betas. Note: you don't need to report all the output you got from the Analysis ToolPack or your favorite statistical software e [ipt) Which fund had the highest CAPM alpha? Is this alpha statistically significantly different from zero? -3.09 201608 201609 201610 0.5 0.25 1.15 2.02 -4.37 3.31 -1.48 4.18 0.02 0.02 0.11765 0.05355 1.05718 1.71184 -7.05937 0.51602 0.53517 -0.55 0.65 -2.02 0.02 1.82568 3.65927 5.41487 6.55084 4.86 5.49 8.27 -4.22 0.01 5.08048 -1.96266 1.82 0.07 3.6 0.03 0.62828 201611 201612 201701 201702 -0.36 -0.97 0.04 4.10156 1.94 3.57 0.17 -1.02 -2 -2.78 -1.8 -3.18 -1.9 -3.78 -1.66 -0.92 0.53 1.19 0.73 -2.55 2.16 1.09 1.98069 1.89655 4.00451 0.0772 1.0343 1.40086 0.59919 201703 201704 201705 201706 201707 201708 2.74887 2.75325 0.42493 1.38784 0.32354 1.06 0.04 0.03 0.05 0.06 0.06 0.07 0.09 3.70544 0.45228 0.76542 0.58088 2.70991 1.85986 0.3397 1.47 -0.25 1.63 3.57 0.78 1.32 2.03453 1.29048 -1.4 -0.28 2.07006 1.87 0.16 -1.69 -2.24 0.26001 0.36058 3.03 -1.2 0.09 2.08141 3.81495 4.54 -1.94 4.3 2.34814 2.51 2.25 3.12 1.06 0.09 0.08 -0.66 -0.75 201709 201710 201711 201712 201801 201802 3.04239 4.86669 3.02663 2.54602 1.90985 3.86057 -0.06 -0.05 0.14 -1.37 -1.19 2.37375 3.02341 0.28182 -1.26 -1.6 0.09 1.08506 5.58 -3.03 3.93 0.11 5.74602 3.90815 -3.65 0.28 3.98 0.11 0.97438 3.69863 3.20867 1.50503 201803 -2.35 3.93 -0.11 -1.26 0.12 2.21587 0.29 1.1 0.53 0.14 201804 201805 201806 2.56613 0.39043 2.43072 2.65 0.48 0.14 0.27 3.76 -2.43 5.24 1.17 -3.16 -2.39 0.25991 5.81119 1.1988 0.14 0.61606 2.23776 10.32832 2.01488 -0.45579 13.00366 -0.2161 -2.15 0.39 -1.61 0.16 3.69668 0.9899 201807 201808 201809 3.19 3.44 0.06 -4.12 5.3 7.0214 1.23 -2.37 0.16 0.15 3.24497 0.58083 -1.34 -0.09 1.34211 201810 -7.68 -4.68 3.41 -1.82 0.19 -13.9957 6.85537 2.04179 11.3283 1.90456 201811 1.69 -0.75 0.22 -1.39 0.18 -1.0768
Step by Step Solution
There are 3 Steps involved in it

Get step-by-step solutions from verified subject matter experts