

Question: Problem 2 : Let's make a plot that shows the vector velocity of a ball undergoing projectile motion ( neglecting air resistance ) . Recall
Problem :
Let's make a plot that shows the vector velocity of a ball undergoing projectile motion neglecting air resistance
Recall the kinematic equations used to calculate the trajectory or the and positions of a ball undergoing projectile motion are as follows:
where and are the initial positions in the and direction, and are the initial velocities in the and directions, and is the acceleration of gravity.
Write code that uses a for loop to calculate the and positions from to with and store them in arrays. Set Plot the and positions against one another to produce a curve like the one shown at the end of this problem.
Copy the code from above and paste it in the code cell below. Change your program so that the magnitude of the initial speed and its angle with respect to ground can be input by the user using an input prompt. Use the speed and angle to calculate the and components of the initial velocity ie calculate and rather than specify them Use a while loop to calculate how the position of the projectile changes and values until it hits the ground or is very close to hitting the ground Again, plot the and positions against one another to produce a curve like the one shown at the end of this problem.
Copy and paste your code from above into the code cell below. Add code inside your while loop that calculates and stores how the velocity in the and direction changes with time.
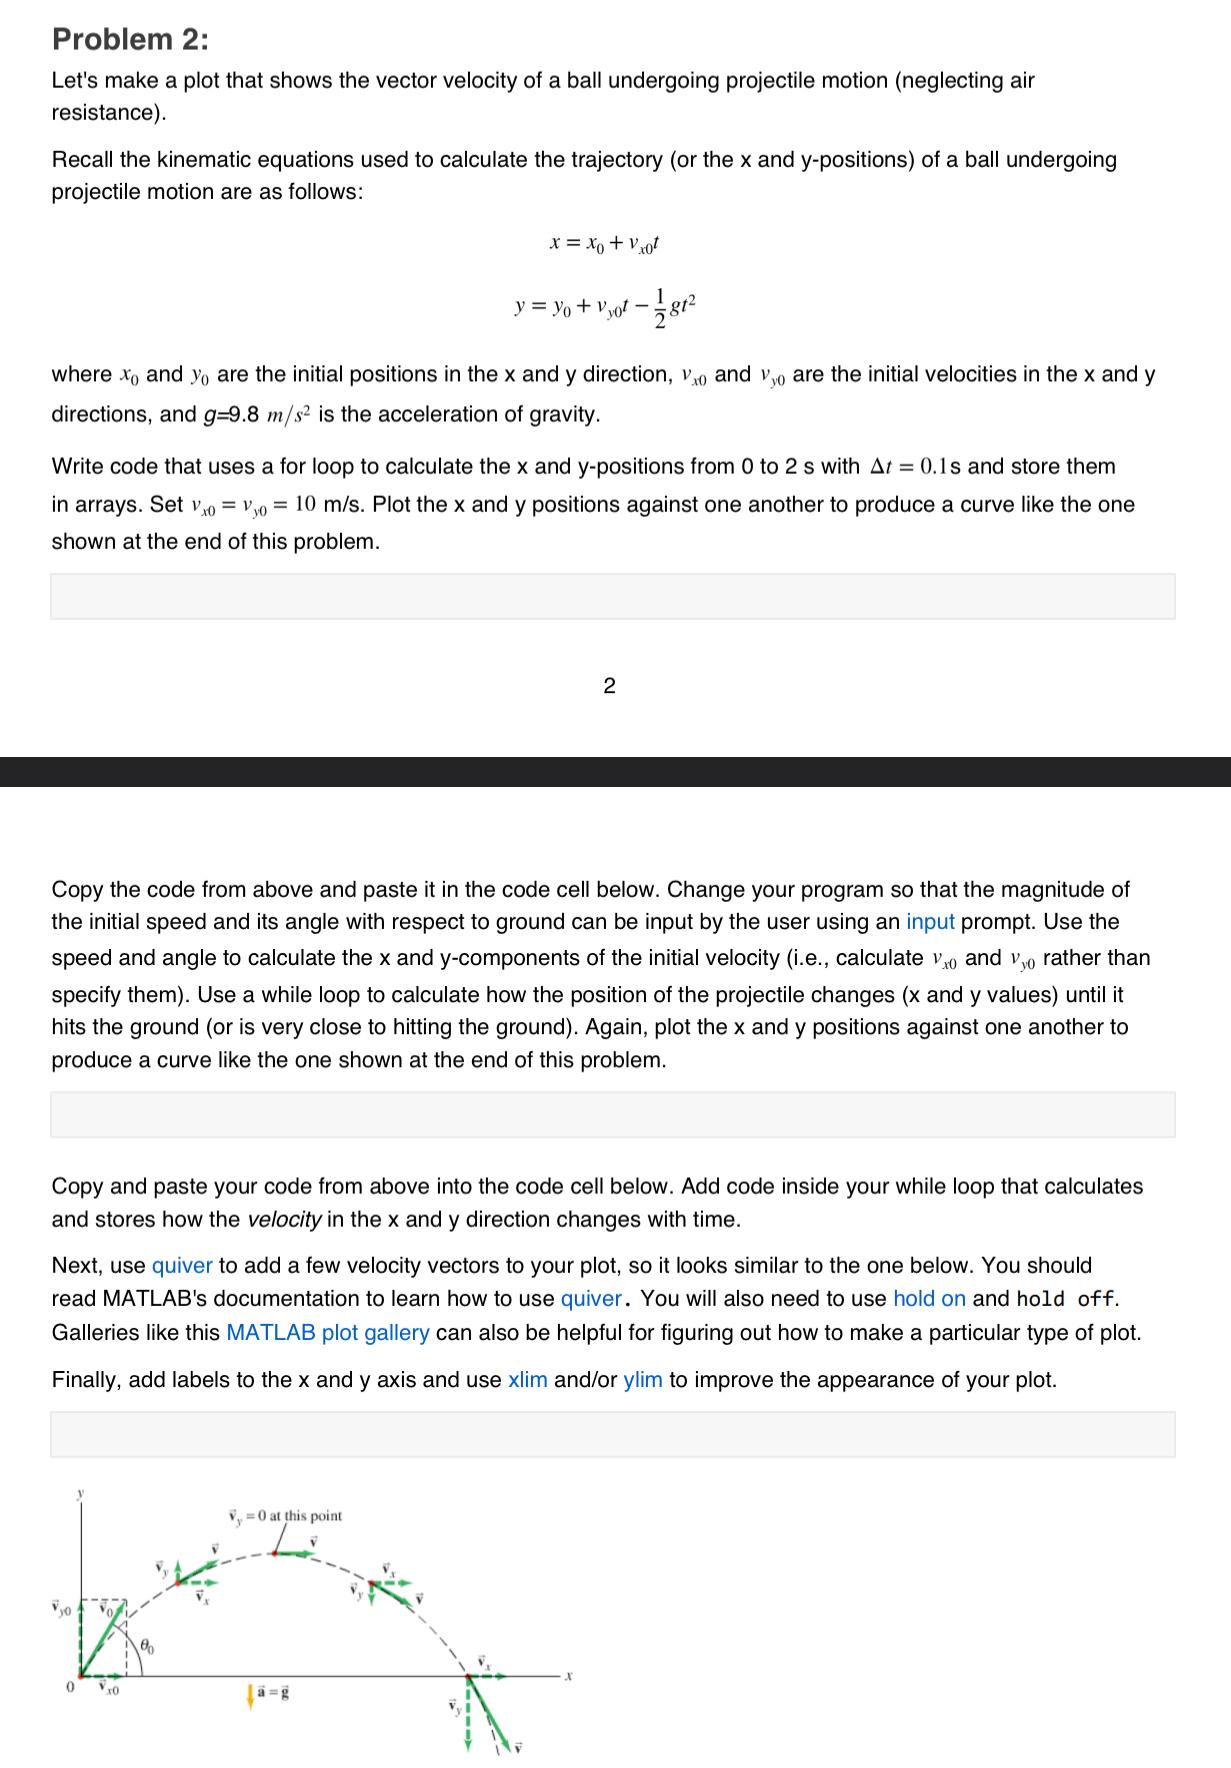
Next, use quiver to add a few velocity vectors to your plot, so it looks similar to the one below. You should read MATLAB's documentation to learn how to use quiver. You will also need to use hold on and hold off. Galleries like this MATLAB plot gallery can also be helpful for figuring out how to make a particular type of plot.
Finally, add labels to the and axis and use xlim andor ylim to improve the appearance of your plot.
Step by Step Solution
There are 3 Steps involved in it
1 Expert Approved Answer
Step: 1 Unlock

Question Has Been Solved by an Expert!
Get step-by-step solutions from verified subject matter experts
Step: 2 Unlock
Step: 3 Unlock