

Question: PROBLEM 2: On the next page you will find two figures. Figure 1 (a) shows the 200hPau-wind and the 650hPa vertical motion, while Figure 1(b)
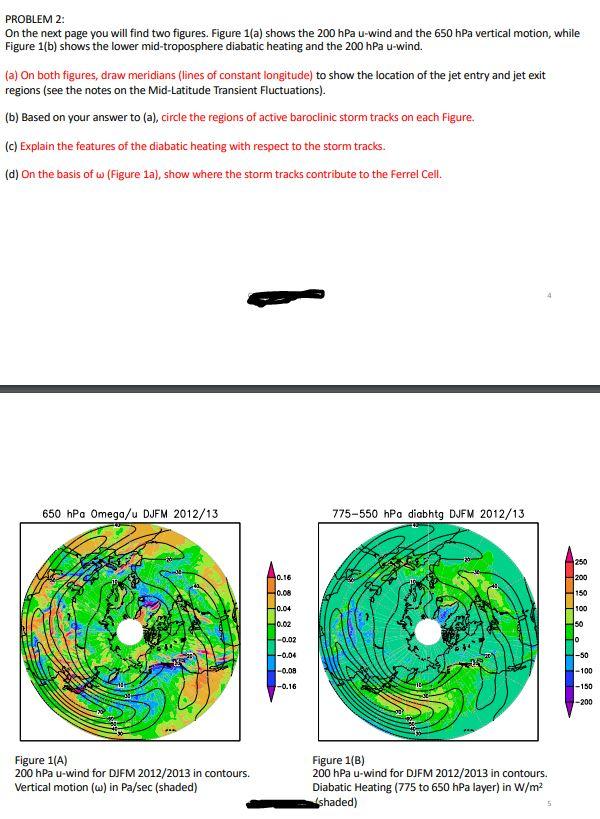
PROBLEM 2: On the next page you will find two figures. Figure 1 (a) shows the 200hPau-wind and the 650hPa vertical motion, while Figure 1(b) shows the lower mid-troposphere diabatic heating and the 200hPa u-wind. (a) On both figures, draw meridians (lines of constant longitude) to show the location of the jet entry and jet exit regions (see the notes on the Mid-Latitude Transient Fluctuations). (b) Based on your answer to (a), circle the regions of active baroclinic storm tracks on each Figure. (c) Explain the features of the diabatic heating with respect to the storm tracks. (d) On the basis of w (Figure 1a), show where the storm tracks contribute to the ferrel Cell. 650hPa Omeaa/u DJFM 2012/13 775_55 hDn dinhth M.1FM On12/12 Figure 1(A) Figure 1(B) 200hPau-wind for DJFM 2012/2013 in contours. 200hPau-wind for DJFM 2012/2013 in contours. Vertical motion () in Pa/sec (shaded) Diabatic Heating (775 to 650hPa layer) in W/m2 (shaded)
Step by Step Solution
There are 3 Steps involved in it

Get step-by-step solutions from verified subject matter experts