

Question: Problem 2. Remaining time: 175:51 (min:set (1 point) The table below shows the probability distribution ofjob satisfaction scores (1 - 4) for a group of
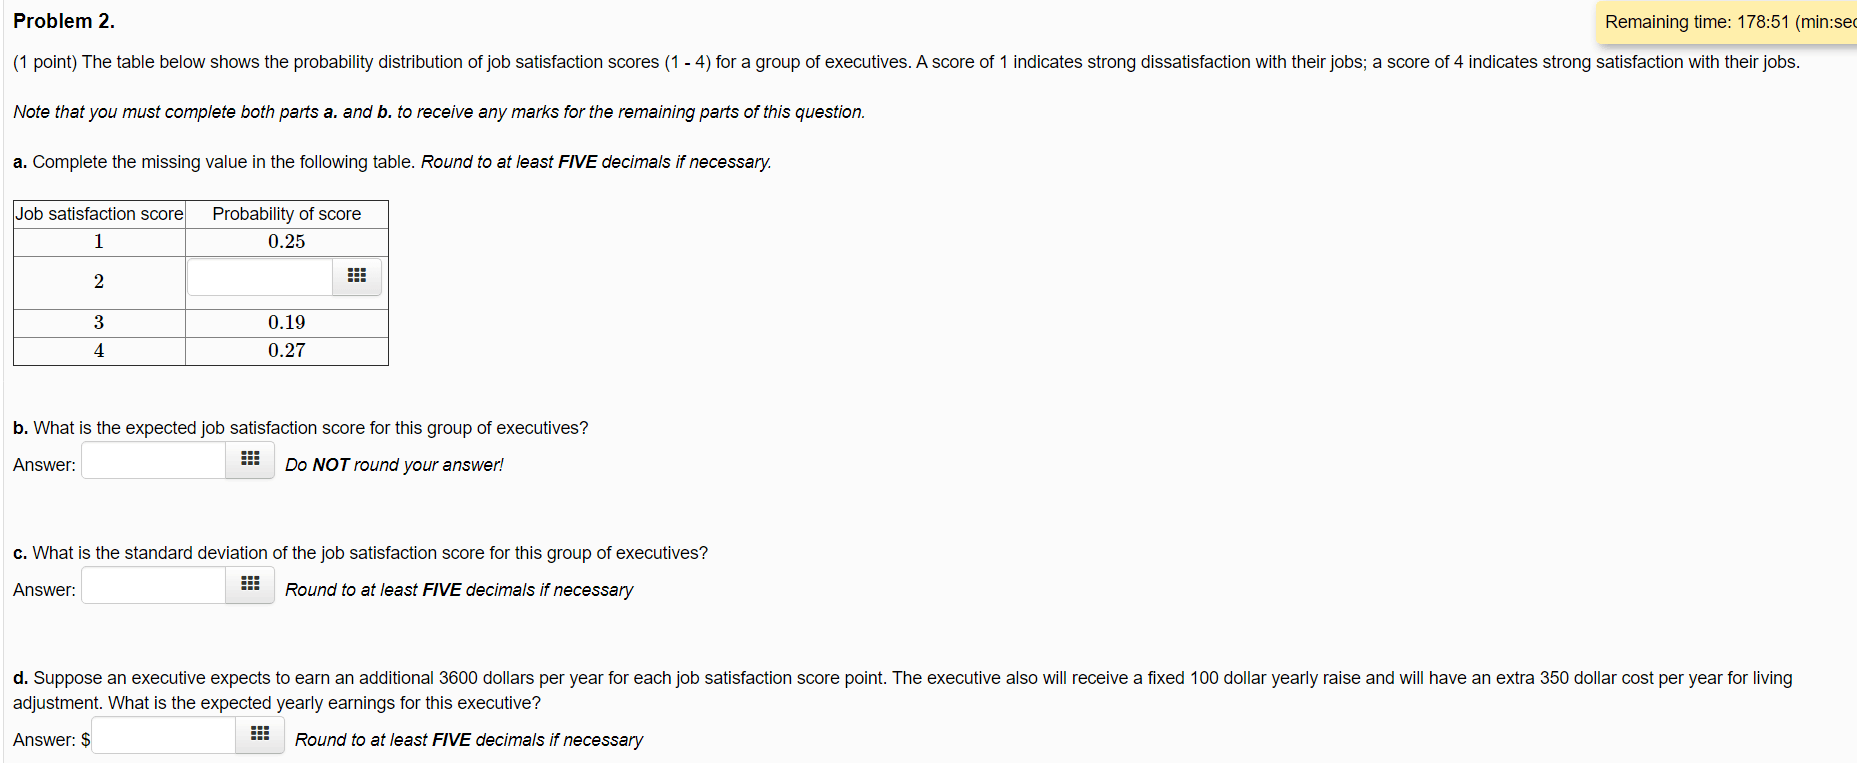
Problem 2. Remaining time: 175:51 (min:set (1 point) The table below shows the probability distribution ofjob satisfaction scores (1 - 4) for a group of executives. A score of 1 indicates strong dissatisfaction with their jobs; a score of 4 indicates strong satisfaction with theirjobs. Note that you must complete both parts a. and b. to receive any marks for the remaining parts of this question. a. Complete the missing value in the following table. Round to at least FIVE decimals if necessary Job satisfaction score Probability of score 1 025 2 7 3 [L19 4 [L27 b. What is the expected job satisfaction score for this group of executives? Answer: Do NOT round your answer! c. What is the standard deviation of the job satistaction score for this group at executives? Answer: Round to at least FIVE decimals if necessary d. Suppose an executive expects to earn an additional 3600 dollars per year for each job satisfaction score point. The executive also will receive a xed 100 dollar yearly raise and will have an extra 350 dollar cost per year for living adjustment. What is the expected yearly earnings for this executive? Answer: $ _ Round to at least FIVE decimals if necessary
Step by Step Solution
There are 3 Steps involved in it

Get step-by-step solutions from verified subject matter experts