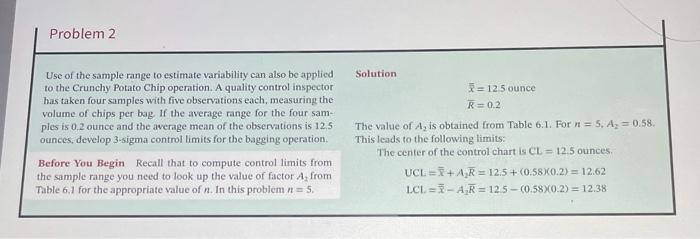
Question: Problem 2 Solution Use of the sample range to estimate variability can also be applied to the Crunchy Potato Chip operation. A quality control inspector

Problem 2 Solution Use of the sample range to
Problem 2 Solution Use of the sample range to estimate variability can also be applied to the Crunchy Potato Chip operation. A quality control inspector has taken four samples with five observations each, measuring the volume of chips per bag If the average range for the four sam ples is 0.2 ounce and the average mean of the observations is 12.5 ounces, develop 3-sigma control limits for the bagging operation. = 12.5 ounce R=0.2 The value of A, is obtained from Table 6.1. For n = 5, A, = 0.58 This leads to the following limits: The center of the control chart is CL = 12.5 ounces. UCL + AR = 12.5+ (0.58X0.2) = 12.62 LCI=2-A R = 12.5 - (0.58X0.2) = 12.38 Before You Begin Recall that to compute control limits from the sample range you need to look up the value of factor A, from Table 6.1 for the appropriate value of n. In this problem n= 5. Sample of Potato Chip Bag Volume in Ounces calculate the mean of the four samples and then use the UCL and LCL formulas Observations Solution Sample Number 1 2 3 4 Average The center line of the control data is the average of the samples: 1 125 123 12.6 12.7 12.525 125.0 12.5 ounces TO 2 12.8 12.4 12.4 12.8 12.6 The control limits are: 3 12.1 126 12.5 12.4 12.4 12.2 4 12.6 12.5 12.3 12.4 UCL = + 0 = 12.5+ =125+3(2)=1280 LCL = -20 = 125 - 2( 2) 12.20 5 12.4 12.5 12.5 12.5 12.475 6 12.3 12.4 12.6 12.6 12.475 7 12.6 12.7 12.5 12.8 12.65 8 124 12.3 12.6 12.5 12.45 9 12.6 12.5 12.3 12.6 12.5 10 12.1 12.7 12.5 12.8 12.525 Total 125.0 Following is the associated control chart: x-Bar Chart (Based on Known Sigma) 12.90 12.80 12.70 - 12.60 - 12.50 OUNCES 12.40 12.30 - 12.20 12.10 Problem 2 Solution Use of the sample range to estimate variability can also be applied to the Crunchy Potato Chip operation. A quality control inspector has taken four samples with five observations each, measuring the volume of chips per bag If the average range for the four sam ples is 0.2 ounce and the average mean of the observations is 12.5 ounces, develop 3-sigma control limits for the bagging operation. = 12.5 ounce R=0.2 The value of A, is obtained from Table 6.1. For n = 5, A, = 0.58 This leads to the following limits: The center of the control chart is CL = 12.5 ounces. UCL + AR = 12.5+ (0.58X0.2) = 12.62 LCI=2-A R = 12.5 - (0.58X0.2) = 12.38 Before You Begin Recall that to compute control limits from the sample range you need to look up the value of factor A, from Table 6.1 for the appropriate value of n. In this problem n= 5. Sample of Potato Chip Bag Volume in Ounces calculate the mean of the four samples and then use the UCL and LCL formulas Observations Solution Sample Number 1 2 3 4 Average The center line of the control data is the average of the samples: 1 125 123 12.6 12.7 12.525 125.0 12.5 ounces TO 2 12.8 12.4 12.4 12.8 12.6 The control limits are: 3 12.1 126 12.5 12.4 12.4 12.2 4 12.6 12.5 12.3 12.4 UCL = + 0 = 12.5+ =125+3(2)=1280 LCL = -20 = 125 - 2( 2) 12.20 5 12.4 12.5 12.5 12.5 12.475 6 12.3 12.4 12.6 12.6 12.475 7 12.6 12.7 12.5 12.8 12.65 8 124 12.3 12.6 12.5 12.45 9 12.6 12.5 12.3 12.6 12.5 10 12.1 12.7 12.5 12.8 12.525 Total 125.0 Following is the associated control chart: x-Bar Chart (Based on Known Sigma) 12.90 12.80 12.70 - 12.60 - 12.50 OUNCES 12.40 12.30 - 12.20 12.10

Step by Step Solution

There are 3 Steps involved in it

1 Expert Approved Answer
Step: 1 Unlock blur-text-image
Question Has Been Solved by an Expert!

Get step-by-step solutions from verified subject matter experts

Step: 2 Unlock
Step: 3 Unlock

Students Have Also Explored These Related General Management Questions!