

Question: Problem 2: Suppose data were collected from a sample of 10 branches of a fast food chain located near College and University campuses in Baguio.

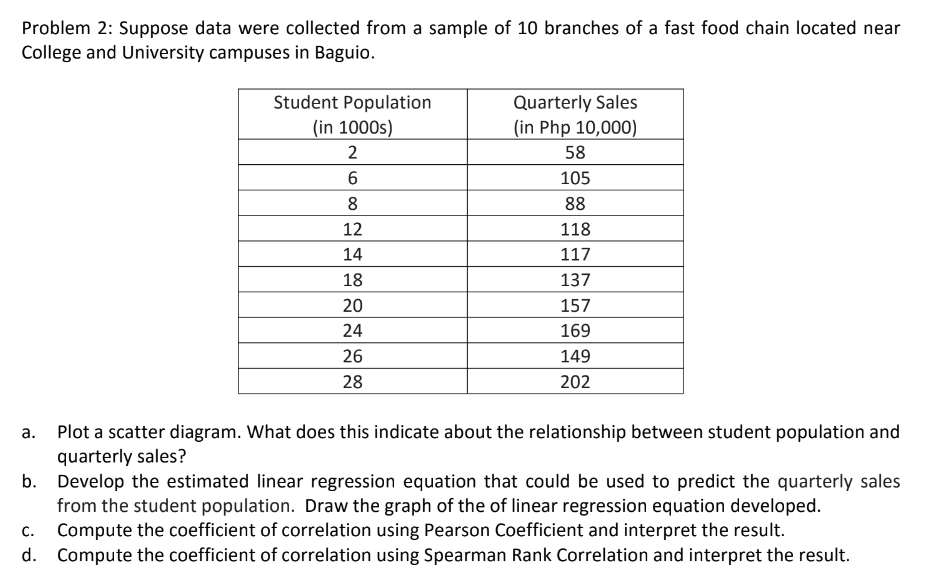
Problem 2: Suppose data were collected from a sample of 10 branches of a fast food chain located near College and University campuses in Baguio. Student Population Quarterly,f Sales [in 10005) [in Php 10,000) 2 53 E 105 8 83 12 118 14 117 18 137 20 157 24 169 26 149 23 202 a. Plot a scatter diagram. What does this indicate about the relationship between student population and quarterly sales? b. Develop the estimated linear regression equation that could be used to predict the quarterh,I sales from the student population. Draw the graph of the of linear regression equation developed. c. Compute the coefficient of correlation using Pearson Coefficient and interpret the result. d. Compute the coefficient of correlation using Spearman Rank Correlation and interpret the result
Step by Step Solution
There are 3 Steps involved in it

Get step-by-step solutions from verified subject matter experts