

Question: Problem 2 The data shown in the table below are temperature measurements made every 2 minutes on an intermediate chemical product (excel table is provided).
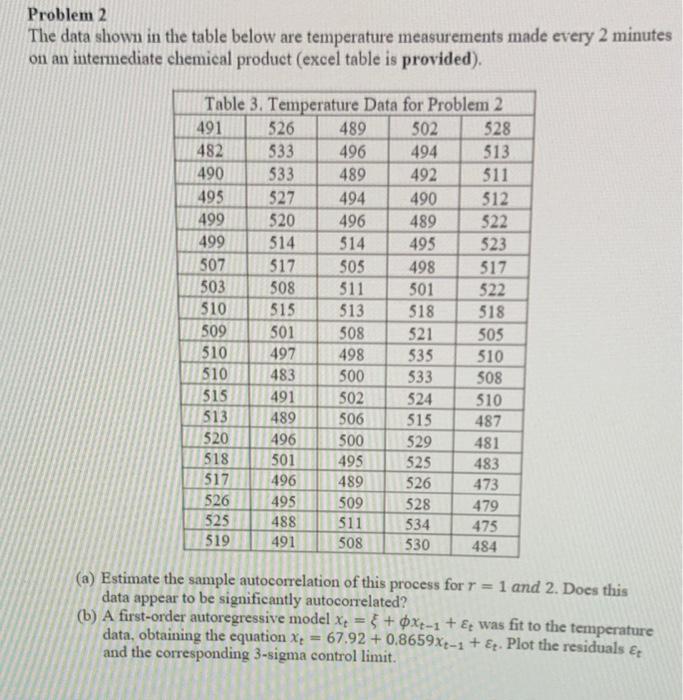
Problem 2 The data shown in the table below are temperature measurements made every 2 minutes on an intermediate chemical product (excel table is provided). (a) Estimate the sample autocorrelation of this process for r=1 and 2. Does this data appear to be significantly autocorrelated? (b) A first-order autoregressive model xt=+xt1+t was fit to the temperature data, obtaining the equation xt=67.92+0.8659xt1+t. Plot the residuals t and the corresponding 3 -sigma control limit. Problem 2 The data shown in the table below are temperature measurements made every 2 minutes on an intermediate chemical product (excel table is provided). (a) Estimate the sample autocorrelation of this process for r=1 and 2. Does this data appear to be significantly autocorrelated? (b) A first-order autoregressive model xt=+xt1+t was fit to the temperature data, obtaining the equation xt=67.92+0.8659xt1+t. Plot the residuals t and the corresponding 3 -sigma control limit
Step by Step Solution
There are 3 Steps involved in it

Get step-by-step solutions from verified subject matter experts