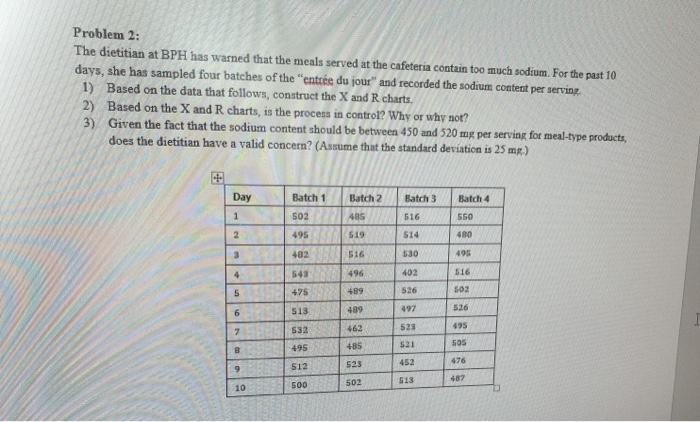
Question: Problem 2: The dietitian at BPH has warned that the meals served at the cafeteria contain too much sodium. For the past 10 days, she

Problem 2: The dietitian at BPH has warned that
Problem 2: The dietitian at BPH has warned that the meals served at the cafeteria contain too much sodium. For the past 10 days, she has sampled four batches of the "entre du jour" and recorded the sodium content per serving 1) Based on the data that follows, construct the X and R charts, 2) Based on the X and R charts, is the process in control? Why or why not? 3) Given the fact that the sodium content should be between 450 and 520 mg per serving for meal-type products, does the dietitian have a valid concern? (Assume that the standard deviation is 25 me) Day Batch 3 Batch 4 Batch 1 502 495 Batch 2 485 519 1 2 516 550 514 480 3 482 516 405 543 496 402 516 5 475 489 526 SOZ 513 6 489 497 526 7 532 462 523 495 sos B 495 521 485 523 452 476 9 512 502 513 487 10 500

Step by Step Solution

There are 3 Steps involved in it

1 Expert Approved Answer
Step: 1 Unlock blur-text-image
Question Has Been Solved by an Expert!

Get step-by-step solutions from verified subject matter experts

Step: 2 Unlock
Step: 3 Unlock

Students Have Also Explored These Related General Management Questions!