

Question: Problem 2: The figure 1 shows the bar chart and resource histogram of another project. 1. Explain the utility (the use) of the bar chart
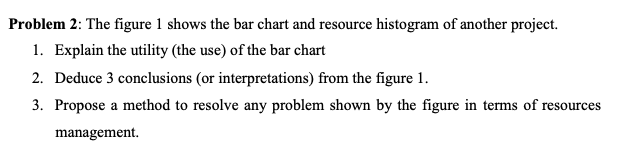
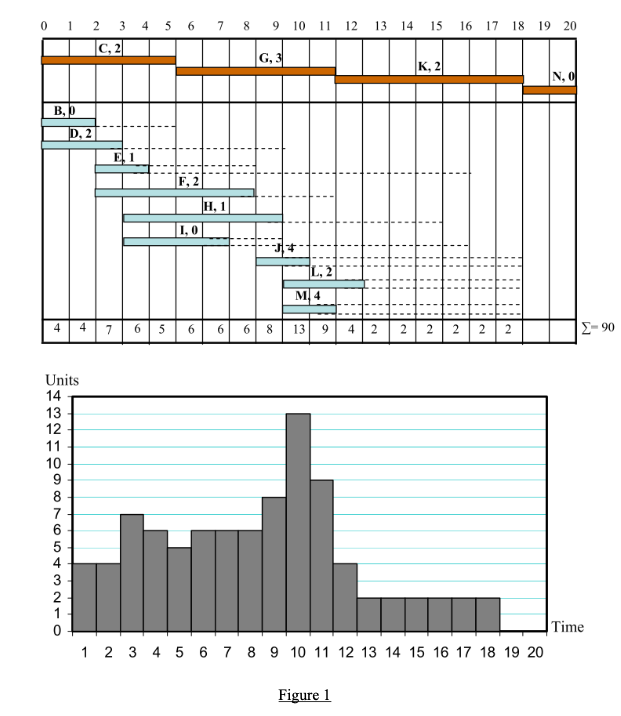
Problem 2: The figure 1 shows the bar chart and resource histogram of another project. 1. Explain the utility (the use) of the bar chart 2. Deduce 3 conclusions (or interpretations) from the figure 1 . 3. Propose a method to resolve any problem shown by the figure in terms of resources management. Figure 1
Step by Step Solution
There are 3 Steps involved in it
1 Expert Approved Answer
Step: 1 Unlock

Question Has Been Solved by an Expert!
Get step-by-step solutions from verified subject matter experts
Step: 2 Unlock
Step: 3 Unlock