

Question: PROBLEM #2 The figure below demonstrates the short-run average cost curves for a coffee company when it uses one, two, three, and four machines. pound
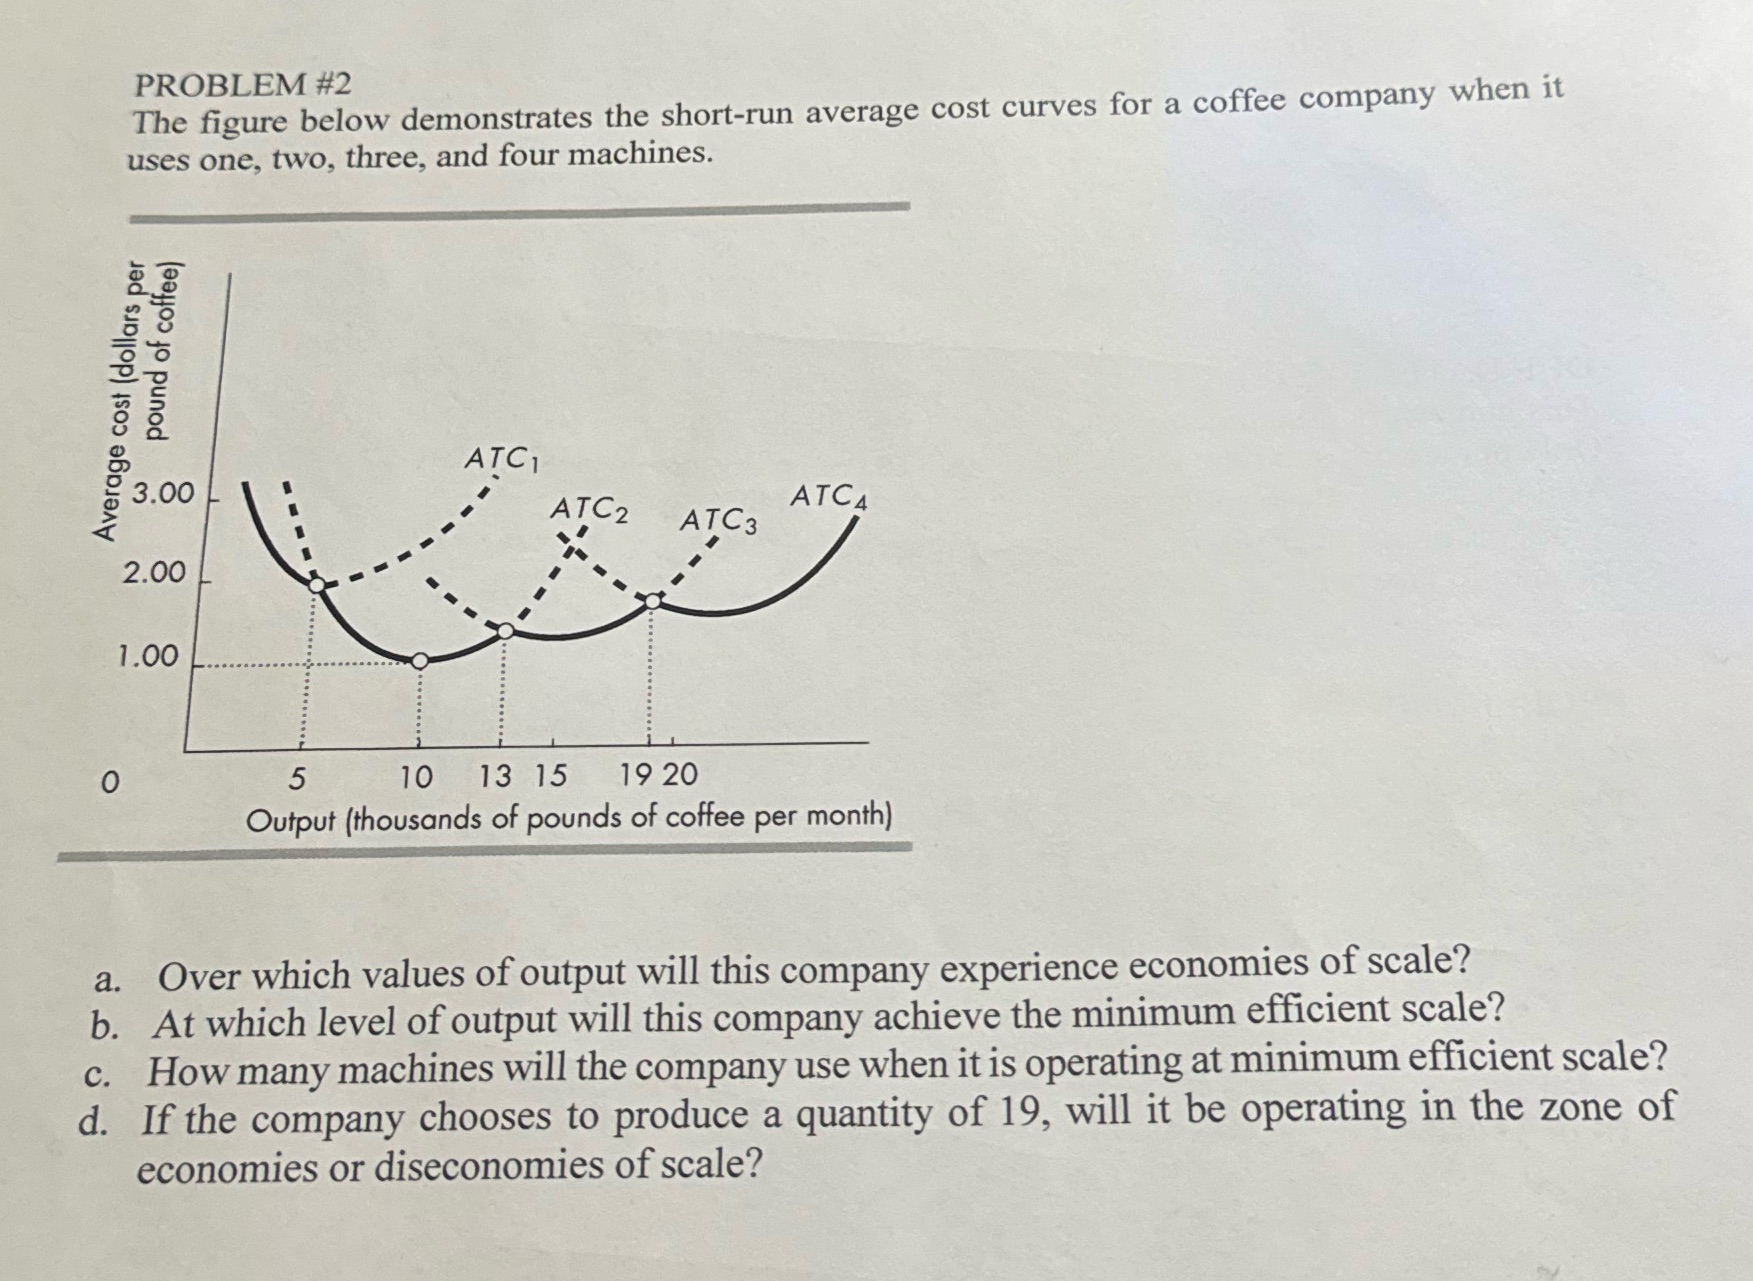
PROBLEM #2 The figure below demonstrates the short-run average cost curves for a coffee company when it uses one, two, three, and four machines. pound of coffee) Average cost (dollars per ATC1 3.00 ATC2 ATC3 ATC4 2.00 1.00 O 5 10 13 15 19 20 Output (thousands of pounds of coffee per month) a. Over which values of output will this company experience economies of scale? b. At which level of output will this company achieve the minimum efficient scale? c. How many machines will the company use when it is operating at minimum efficient scale? d. If the company chooses to produce a quantity of 19, will it be operating in the zone of economies or diseconomies of scale
Step by Step Solution
There are 3 Steps involved in it

Get step-by-step solutions from verified subject matter experts