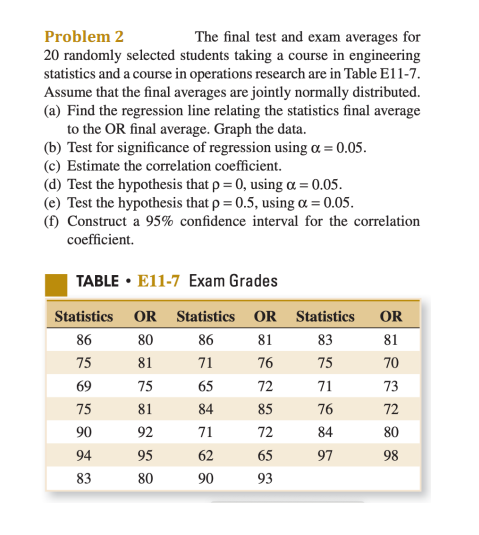
Question: Problem 2 The final test and exam averages for 20 randomly selected students taking a course in engineering statistics and a course in operations research

Problem 2 The final test and exam averages for 20

Problem 2 The final test and exam averages for 20 randomly selected students taking a course in engineering statistics and a course in operations research are in Table E11-7. Assume that the final averages are jointly normally distributed. (a) Find the regression line relating the statistics final average to the OR final average. Graph the data. (b) Test for significance of regression using a = 0.05. (c) Estimate the correlation coefficient. (d) Test the hypothesis that p = 0, using a = 0.05. (e) Test the hypothesis that p = 0.5, using a = 0.05. (f) Construct a 95% confidence interval for the correlation coefficient 81 TABLE E11-7 Exam Grades Statistics OR Statistics OR Statistics OR 86 80 86 81 83 81 75 71 76 75 70 69 75 72 71 73 75 81 84 85 76 72 90 92 71 72 84 80 94 95 62 65 97 98 83 80 90 93 65

Step by Step Solution

There are 3 Steps involved in it

1 Expert Approved Answer
Step: 1 Unlock blur-text-image
Question Has Been Solved by an Expert!

Get step-by-step solutions from verified subject matter experts

Step: 2 Unlock
Step: 3 Unlock

Students Have Also Explored These Related General Management Questions!