

Question: Problem 2. The gure below shows Sue's and Carlos' demand curves for gasoline. Price ( per liter) 15 10 Carlos 0 0 1000 2000 3000
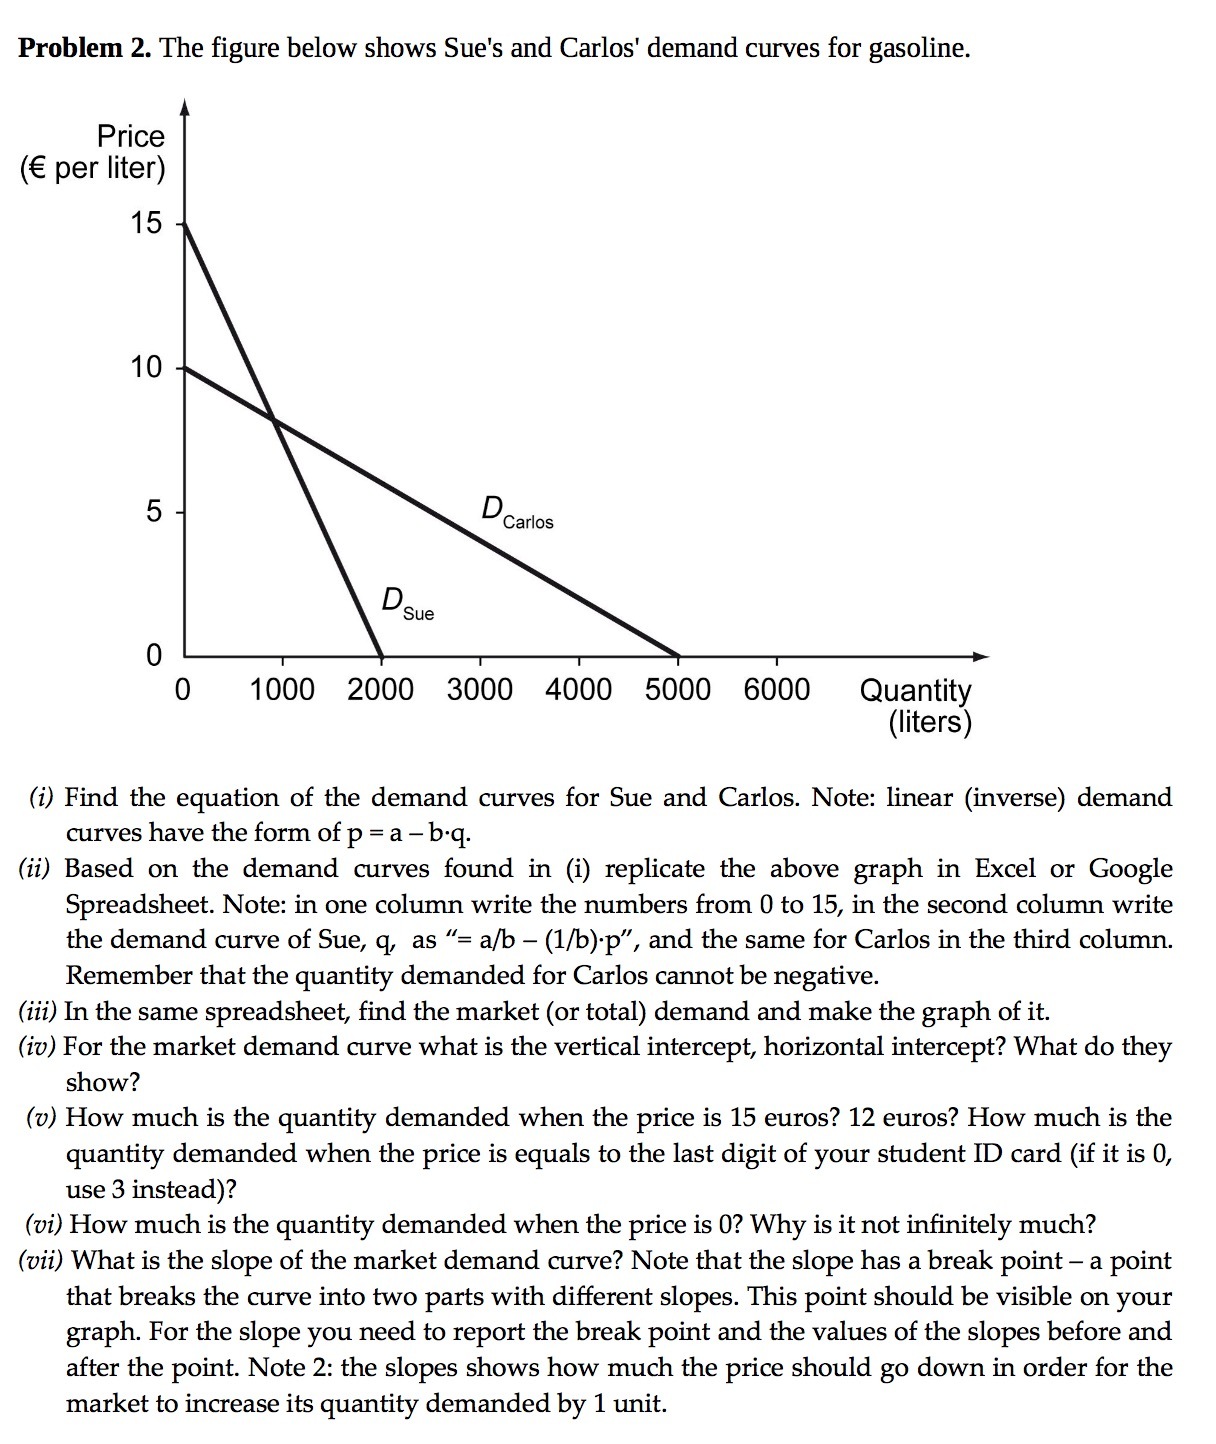
Problem 2. The gure below shows Sue's and Carlos' demand curves for gasoline. Price ( per liter) 15 10 Carlos 0 0 1000 2000 3000 4000 5000 6000 Quantity (liters) (1') Find the equation of the demand curves for Sue and Carlos. Note: linear (inverse) demand curves have the form of p = a b-q. (ii) Based on the demand curves found in (i) replicate the above graph in Excel or Google Spreadsheet. Note: in one column write the numbers from 0 to 15, in the second column write the demand curve of Sue, q, as \"= a/b (1/b)-p\
Step by Step Solution
There are 3 Steps involved in it
1 Expert Approved Answer
Step: 1 Unlock

Question Has Been Solved by an Expert!
Get step-by-step solutions from verified subject matter experts
Step: 2 Unlock
Step: 3 Unlock