

Question: Problem 2 The maximum amount that housing developers and farmers are willing to pay for land is depicted in the table below: Housing Farmer's Bid
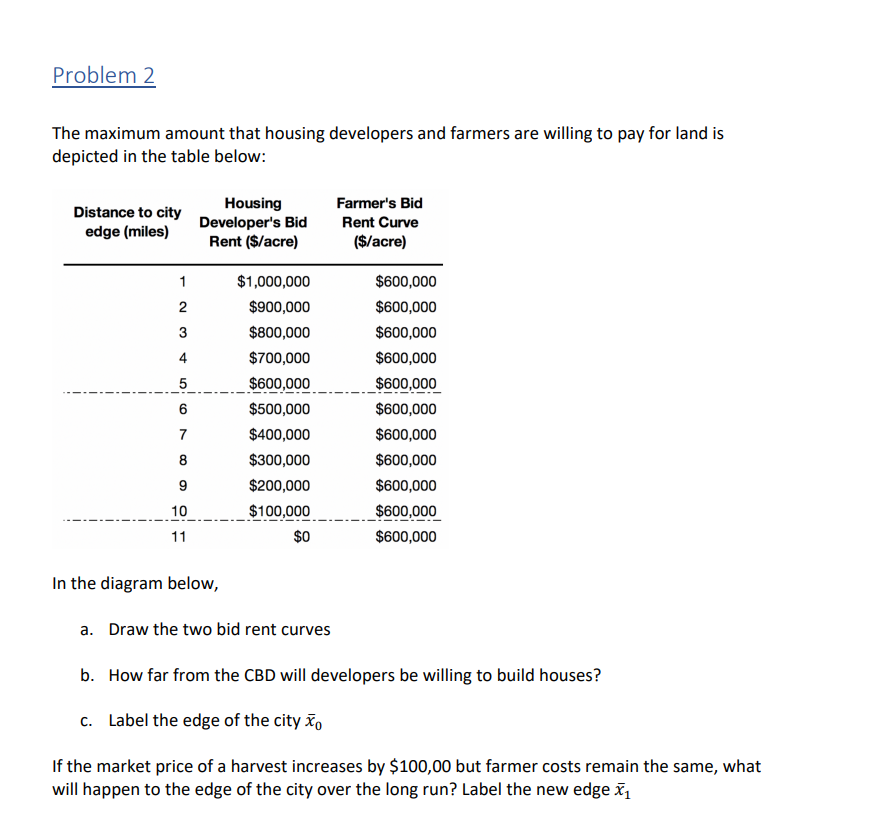
Problem 2 The maximum amount that housing developers and farmers are willing to pay for land is depicted in the table below: Housing Farmer's Bid Distance to city Developer's Bid Rent Curve edge (miles) Rent ($/acre) ($/acre) $1,000,000 $600,000 $900,000 $600,000 $800,000 $600,000 A $700,000 $600,000 5 $600,000 $600,000 6 $500,000 $600,000 $400,000 $600,000 $300,000 $600,000 $200,000 $600,000 10 $100,000 $600,000 11 $0 $600,000 In the diagram below, a. Draw the two bid rent curves b. How far from the CBD will developers be willing to build houses? c. Label the edge of the city Xo If the market price of a harvest increases by $100,00 but farmer costs remain the same, what will happen to the edge of the city over the long run? Label the new edge x1$1,000,000 $900,000 $800.000 $700,000 $600.000 $500,000 $400.000 $300,000 $200,000 $100,000 9 10 11 12 13 14 15
Step by Step Solution
There are 3 Steps involved in it

Get step-by-step solutions from verified subject matter experts