

Question: Problem 2: (This problem is similar to Textbook problem 3.11 pg 78) ABC Corporation's consolidated income statements and balance sheet for the years 2017 and
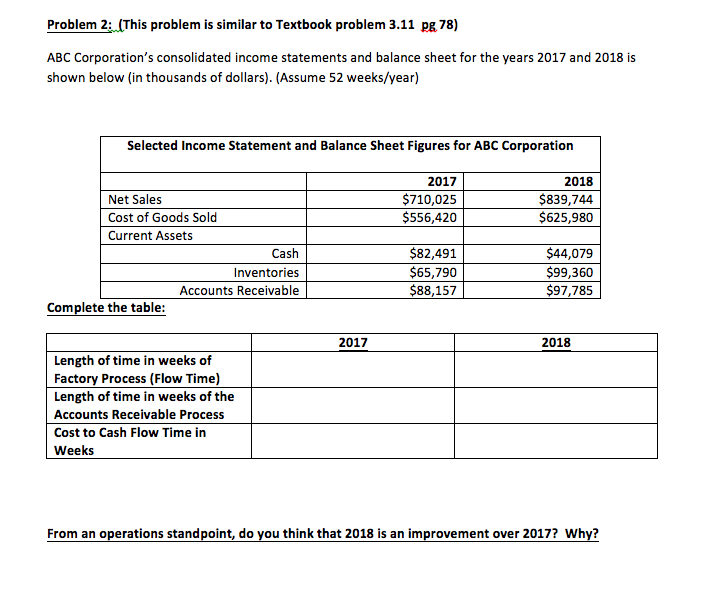
Problem 2: (This problem is similar to Textbook problem 3.11 pg 78) ABC Corporation's consolidated income statements and balance sheet for the years 2017 and 2018 is shown below (in thousands of dollars). (Assume 52 weeks/year) Selected Income Statement and Balance Sheet Figures for ABC Corporation 2017 $710,025 $556,420 2018 $839,744 $625,980 Net Sales Cost of Goods Sold Current Assets Cash Inventories Accounts Receivable Complete the table: $82,491 $65,790 $88,157 $44,079 $99,360 $97,785 2017 2018 Length of time in weeks of Factory Process (Flow Time) Length of time in weeks of the Accounts Receivable Process Cost to Cash Flow Time in Weeks From an operations standpoint, do you think that 2018 is an improvement over 2017? Why? Problem 2: (This problem is similar to Textbook problem 3.11 pg 78) ABC Corporation's consolidated income statements and balance sheet for the years 2017 and 2018 is shown below (in thousands of dollars). (Assume 52 weeks/year) Selected Income Statement and Balance Sheet Figures for ABC Corporation 2017 $710,025 $556,420 2018 $839,744 $625,980 Net Sales Cost of Goods Sold Current Assets Cash Inventories Accounts Receivable Complete the table: $82,491 $65,790 $88,157 $44,079 $99,360 $97,785 2017 2018 Length of time in weeks of Factory Process (Flow Time) Length of time in weeks of the Accounts Receivable Process Cost to Cash Flow Time in Weeks From an operations standpoint, do you think that 2018 is an improvement over 2017? Why
Step by Step Solution
There are 3 Steps involved in it

Get step-by-step solutions from verified subject matter experts