

Question: Problem 2 (Unit 1). Theoretically, when crude oil prices increase (decrease), gasoline prices at the pump increase (decrease). The following table reports the data
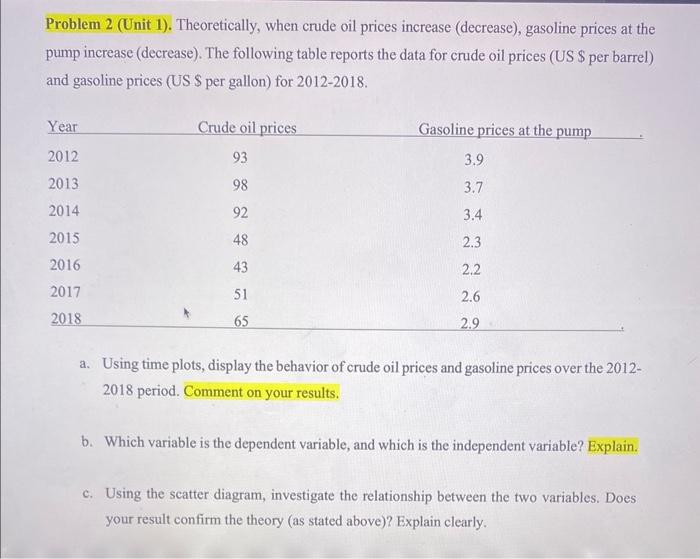
Problem 2 (Unit 1). Theoretically, when crude oil prices increase (decrease), gasoline prices at the pump increase (decrease). The following table reports the data for crude oil prices (US $ per barrel) and gasoline prices (US $ per gallon) for 2012-2018. Year 2012 2013 2014 2015 2016 2017 2018 Crude oil prices 93 98 92 48 43 51 65 Gasoline prices at the pump 3.9 3.7 3.4 2.3 2.2 2.6 2.9 a. Using time plots, display the behavior of crude oil prices and gasoline prices over the 2012- 2018 period. Comment on your results. b. Which variable is the dependent variable, and which is the independent variable? Explain. c. Using the scatter diagram, investigate the relationship between the two variables. Does your result confirm the theory (as stated above)? Explain clearly.
Step by Step Solution
3.41 Rating (160 Votes )
There are 3 Steps involved in it
The concepts of time series plot scatterplot can be use... View full answer

Get step-by-step solutions from verified subject matter experts