

Question: Problem 2 Using the following data Samples 9/8/12 9/8/12 9/8/12 9/8/12 9/8/12 9/8/12 9/8/12 9/8/12 9/8/12 9/8/12 7:30 7:45 8:00 8:15 8:30 8:45 9:00 9:15
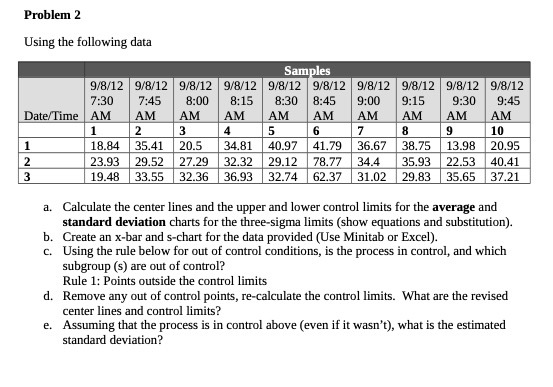
Problem 2 Using the following data Samples 9/8/12 9/8/12 9/8/12 9/8/12 9/8/12 9/8/12 9/8/12 9/8/12 9/8/12 9/8/12 7:30 7:45 8:00 8:15 8:30 8:45 9:00 9:15 9:30 9:45 Date/Time AM AM AM AM AM AM AM AM AM AM 1 2 3 4 5 6 7 8 10 1 18.84 35.41 20.5 34.81 40.97 41.79 36.67 38.75 13.98 20.95 2 23.93 29.52 27.29 32.32 29.12 78.77 34.4 35.93 22.53 40.41 19.48 33.55 32.36 36.93 32.74 62.37 31.02 29.83 35.65 37.21 a. Calculate the center lines and the upper and lower control limits for the average and standard deviation charts for the three-sigma limits (show equations and substitution). b. Create an x-bar and s-chart for the data provided (Use Minitab or Excel). C. Using the rule below for out of control conditions, is the process in control, and which subgroup (s) are out of control? Rule 1: Points outside the control limits d. Remove any out of control points, re-calculate the control limits. What are the revised center lines and control limits? e. Assuming that the process is in control above (even if it wasn't), what is the estimated standard deviation
Step by Step Solution
There are 3 Steps involved in it

Get step-by-step solutions from verified subject matter experts