

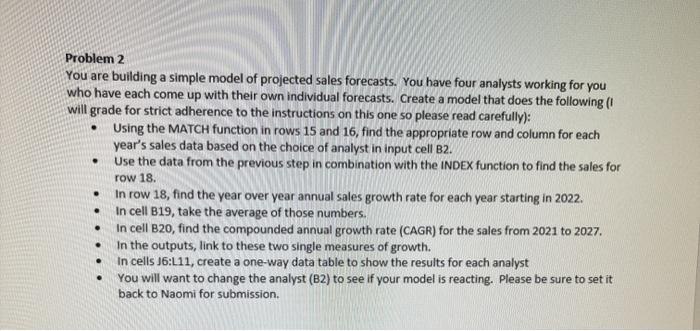
Question: . Problem 2 You are building a simple model of projected sales forecasts. You have four analysts working for you who have each come up
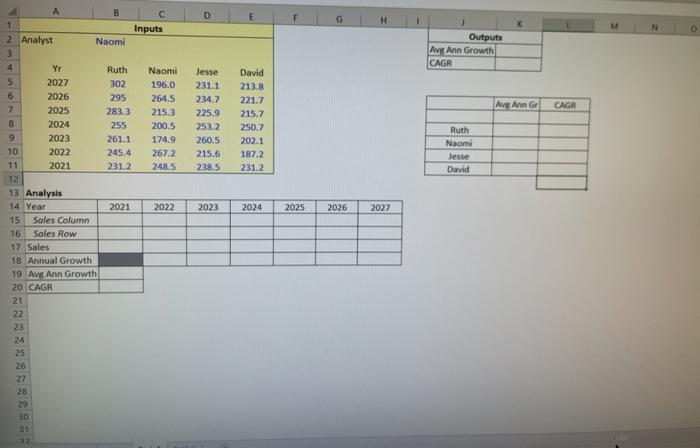
. Problem 2 You are building a simple model of projected sales forecasts. You have four analysts working for you who have each come up with their own individual forecasts. Create a model that does the following (1 will grade for strict adherence to the instructions on this one so please read carefully): Using the MATCH function in rows 15 and 16, find the appropriate row and column for each year's sales data based on the choice of analyst in input cell B2. Use the data from the previous step in combination with the INDEX function to find the sales for row 18. In row 18, find the year over year annual sales growth rate for each year starting in 2022. In cell B19, take the average of those numbers. In cell B20, find the compounded annual growth rate (CAGR) for the sales from 2021 27. In the outputs, link to these two single measures of growth. In cells 36:L11, create a one-way data table to show the results for each analyst You will want to change the analyst (B2) to see if your model is reacting. Please be sure to set it back to Naomi for submission . . . . . . D E N o Outputs Avg Ann Growth CAGR Ave Ann Go CAGR Jesse 231.1 234.7 225.9 253.2 260.5 215.6 238.5 David 213.8 221.7 215.7 250.7 202.1 187.2 231.2 Ruth Naomi Jesse David A B 1 Inputs 2 Analyst Naomi 3 4 Yr Ruth Naomi 5 2027 302 196.0 6 2026 295 264.5 7 2025 283,3 215.3 8 2024 255 200.5 9 2023 261.1 174.9 10 2022 245.4 267.2 2021 231.2 248.5 12 13 Analysis 14 Year 2021 2022 15 Sales Column 16 Sales Row 17 Sales 18 Annual Growth 19 Avg Ann Growth 20 CAGR 21 22 23 24 25 26 2023 2024 2025 2026 2027 28 29 30 31 22 . Problem 2 You are building a simple model of projected sales forecasts. You have four analysts working for you who have each come up with their own individual forecasts. Create a model that does the following (1 will grade for strict adherence to the instructions on this one so please read carefully): Using the MATCH function in rows 15 and 16, find the appropriate row and column for each year's sales data based on the choice of analyst in input cell B2. Use the data from the previous step in combination with the INDEX function to find the sales for row 18. In row 18, find the year over year annual sales growth rate for each year starting in 2022. In cell B19, take the average of those numbers. In cell B20, find the compounded annual growth rate (CAGR) for the sales from 2021 27. In the outputs, link to these two single measures of growth. In cells 36:L11, create a one-way data table to show the results for each analyst You will want to change the analyst (B2) to see if your model is reacting. Please be sure to set it back to Naomi for submission . . . . . . D E N o Outputs Avg Ann Growth CAGR Ave Ann Go CAGR Jesse 231.1 234.7 225.9 253.2 260.5 215.6 238.5 David 213.8 221.7 215.7 250.7 202.1 187.2 231.2 Ruth Naomi Jesse David A B 1 Inputs 2 Analyst Naomi 3 4 Yr Ruth Naomi 5 2027 302 196.0 6 2026 295 264.5 7 2025 283,3 215.3 8 2024 255 200.5 9 2023 261.1 174.9 10 2022 245.4 267.2 2021 231.2 248.5 12 13 Analysis 14 Year 2021 2022 15 Sales Column 16 Sales Row 17 Sales 18 Annual Growth 19 Avg Ann Growth 20 CAGR 21 22 23 24 25 26 2023 2024 2025 2026 2027 28 29 30 31 22
Step by Step Solution
There are 3 Steps involved in it

Get step-by-step solutions from verified subject matter experts