

Question: Problem 22: Solution Wilkin Inn Comparative Income Statement For the Years of 20X1 and 20X2 Difference 20X1 20X2 $ 9% Total Revenues $1,000,000 $1,200,000 $200,000

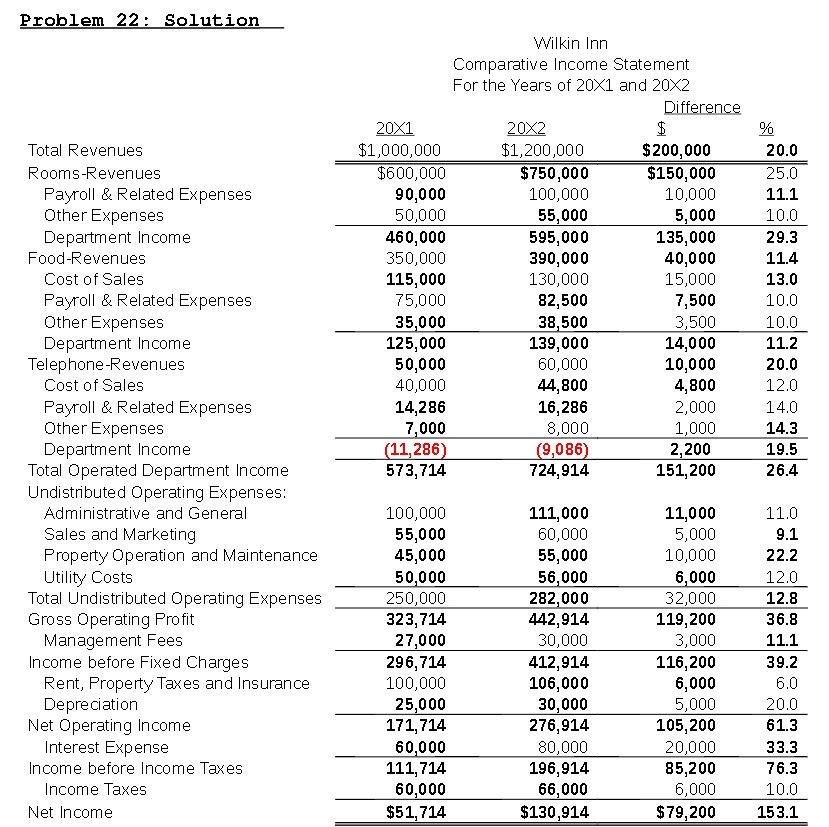
Problem 22: Solution Wilkin Inn Comparative Income Statement For the Years of 20X1 and 20X2 Difference 20X1 20X2 $ 9% Total Revenues $1,000,000 $1,200,000 $200,000 20.0 Rooms-Revenues $600,000 $750,000 $150,000 25.0 Payroll & Related Expenses 90,000 100,000 10,000 11.1 Other Expenses 50,000 55, 000 5,000 10,0 Department Income 460,000 595,000 135,000 29.3 Food-Revenues 350,000 390,000 40,000 11.4 Cost of Sales 115,000 130,000 15,000 13.0 Payroll & Related Expenses 75,000 82,500 7,500 10.0 Other Expenses 35,000 38,500 3,500 10.0 Department Income 125,000 139,000 14,000 11.2 Telephone-Revenues 50,000 60,000 10,000 20.0 Cost of Sales 40,000 44,800 4,800 12.0 Payroll & Related Expenses 14,286 16,286 2,000 14.0 Other Expenses 7,000 8,000 1,000 14.3 Department Income (11, 286) (9,086) 2,200 19.5 Total Operated Department Income 573,714 724,914 151,200 26.4 Undistributed Operating Expenses: Administrative and General 100,000 111,000 11,000 11.0 Sales and Marketing 55,000 60,000 5,000 9.1 Property Operation and Maintenance 45,000 55,000 10,000 22.2 Utility Costs 50,000 56.000 6,000 12.0 Total Undistributed Operating Expenses 250,000 282,000 32,000 12.8 Gross Operating Profit 323, 714 442,914 119,200 36.8 Management Fees 27,000 30,000 3,000 11.1 Income before Fixed Charges 296, 714 412,914 116,200 39.2 Rent, Property Taxes and Insurance 100,000 106,000 6,000 6.0 Depreciation 25,000 30,000 5,000 20.0 Net Operating Income 171, 714 276,914 105,200 61.3 Interest Expense 60,000 80,000 20,000 33.3 Income before Income Taxes 111, 714 196,914 85,200 76.3 Income Taxes 60,000 66,000 6,000 10.0 Net Income $51, 714 $130,914 $79,200 153.1
Step by Step Solution
There are 3 Steps involved in it

Get step-by-step solutions from verified subject matter experts