

Question: Problem 2-22 High-Low and Scattergraph Analysis [LO2-4, L02-5] Pleasant View Hospital of British Columbia has just hired a new chief administrator who is anxious to
![Problem 2-22 High-Low and Scattergraph Analysis [LO2-4, L02-5] Pleasant View Hospital](https://s3.amazonaws.com/si.experts.images/answers/2024/08/66cc3a408a87b_28766cc3a3fe81ca.jpg)
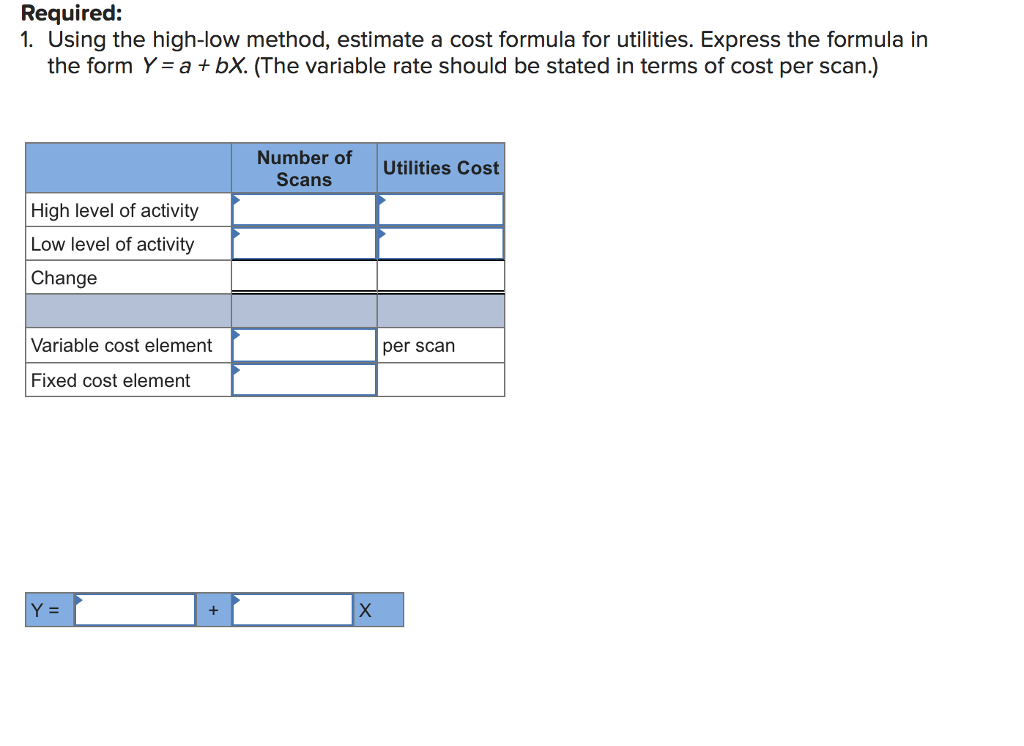
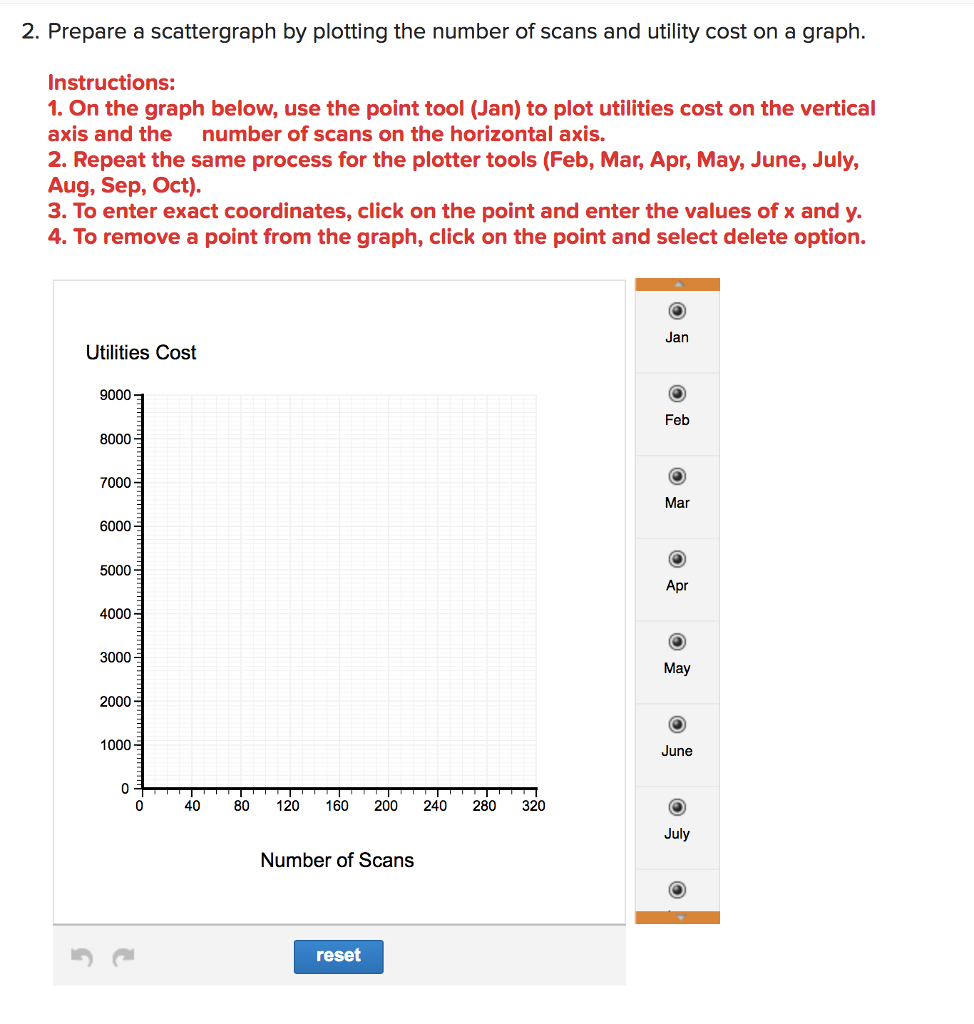
Problem 2-22 High-Low and Scattergraph Analysis [LO2-4, L02-5] Pleasant View Hospital of British Columbia has just hired a new chief administrator who is anxious to employ sound management and planning techniques in the business affairs of the hospital. Accordingly, she has directed her assistant to summarize the cost structure of the various departments so that data will be available for planning purposes. The assistant is unsure how to classify the utilities costs in the Radiology Department because these costs do not exhibit either strictly variable or fixed cost behavior. Utilitie:s costs are very high in the department due to a CAT scanner that draws a large amount of power and is kept running at all times. The scanner can't be turned off due to the long warm-up period required for its use. When the scanner is used to scan a patient, it consumes an additional burst of power. The assistant has accumulated the following data on utilities costs and use of the scanner since the first of the year. Number of Utilities Month January February March April Scans 180 170 160 170 290 280 140 130 120 110 Cost $6,000 $5,000 $4,900 $5,500 $8,200 $7,800 $6,200 $5,400 $5,600 $4,600 June July August September October The chief administrator has informed her assistant that the utilities cost is probably a mixed cost that will have to be broken down into its variable and fixed cost elements by use of a scattergraph. The assistant feels, however, that if an analysis of this type is necessary, then the high-low method should be used, since it is easier and quicker. The controller has suggested that there may be a better approach. Required: 1. Using the high-low method, estimate a cost formula for utilities. Express the formula in the form Y-a +bX. The variable rate should be stated in terms of cost per scan.) Number of Scans Utilities Cost High level of activity Low level of activity Change Variable cost element per scarn Fixed cost element 2. Prepare a scattergraph by plotting the number of scans and utility cost on a graph. Instructions: 1. On the graph below, use the point tool (Jan) to plot utilities cost on the vertical axis and the number of scans on the horizontal axis. 2. Repeat the same process for the plotter tools (Feb, Mar, Apr, May, June, July, Aug, Sep, Oct). 3. To enter exact coordinates, click on the point and enter the values of x and y. . To remove a point from the graph, click on the point and select delete option. Jan Utilities Cost 9000 Feb 8000 7000 Mar 6000 5000 Apr 4000 3000 May 2000 1000 June 40 80 120 160 200 240 280 320 Number of Scans reset
Step by Step Solution
There are 3 Steps involved in it

Get step-by-step solutions from verified subject matter experts