

Question: Problem 2-32 (Outliers and Missing Values) How can I do this using excel? https://cnow.apps.ng.cengage.com/ilrn/books/alba07h/datafile/resource/ch02/P02_32.xlsx Sometimes it is possible that missing data are predictive in the
Problem 2-32 (Outliers and Missing Values)
How can I do this using excel?
https://cnow.apps.ng.cengage.com/ilrn/books/alba07h/datafile/resource/ch02/P02_32.xlsx
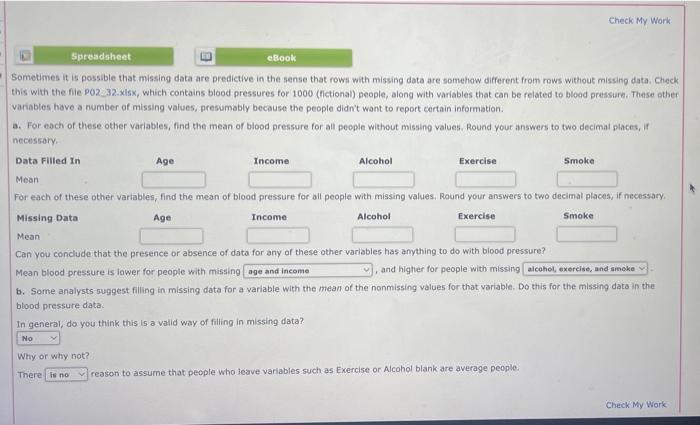
Sometimes it is possible that missing data are predictive in the sense that rows with missing data are somehow different from rows without missing data. Check this with the fie P02.32.xisx, which contains blood pressures for 1000 (fictional) people, along with variables that can be related to blood pressure. Thense other variables have a number of missing values, presumably because the people didn't want to report certain information. a. For each of these other variables, find the mean of blood pressure for all people without missino values. Round your answers to two decimat places, If necessary. Missing Data Age Income Alcohol Mean Can you conclude that the presence or absence of data for any of these other variables has anything to do with biood pressure? Mean blood pressure is lower for people with missing , and higher for people with missing b. Some analysts suggest filling in missing data for a variable with the mean of the nonmissing values for that variable. Do this for the missing data in the blood pressure data. In general, do you think this is a valid way of filling in missing data? Why or why not? There reason to assume that people who leave variables such as Exercise or Alcohol blank are average people. Sometimes it is possible that missing data are predictive in the sense that rows with missing data are somehow different from rows without missing data. Check this with the fie P02.32.xisx, which contains blood pressures for 1000 (fictional) people, along with variables that can be related to blood pressure. Thense other variables have a number of missing values, presumably because the people didn't want to report certain information. a. For each of these other variables, find the mean of blood pressure for all people without missino values. Round your answers to two decimat places, If necessary. Missing Data Age Income Alcohol Mean Can you conclude that the presence or absence of data for any of these other variables has anything to do with biood pressure? Mean blood pressure is lower for people with missing , and higher for people with missing b. Some analysts suggest filling in missing data for a variable with the mean of the nonmissing values for that variable. Do this for the missing data in the blood pressure data. In general, do you think this is a valid way of filling in missing data? Why or why not? There reason to assume that people who leave variables such as Exercise or Alcohol blank are average people
Step by Step Solution
There are 3 Steps involved in it

Get step-by-step solutions from verified subject matter experts