

Question: Problem 24-4 Presented below is the comparative balance sheet for Sheridan Company. SHERIDAN COMPANY COMPARATIVE BALANCE SHEET AS OF DECEMBER 31, 2018 AND 2017 December
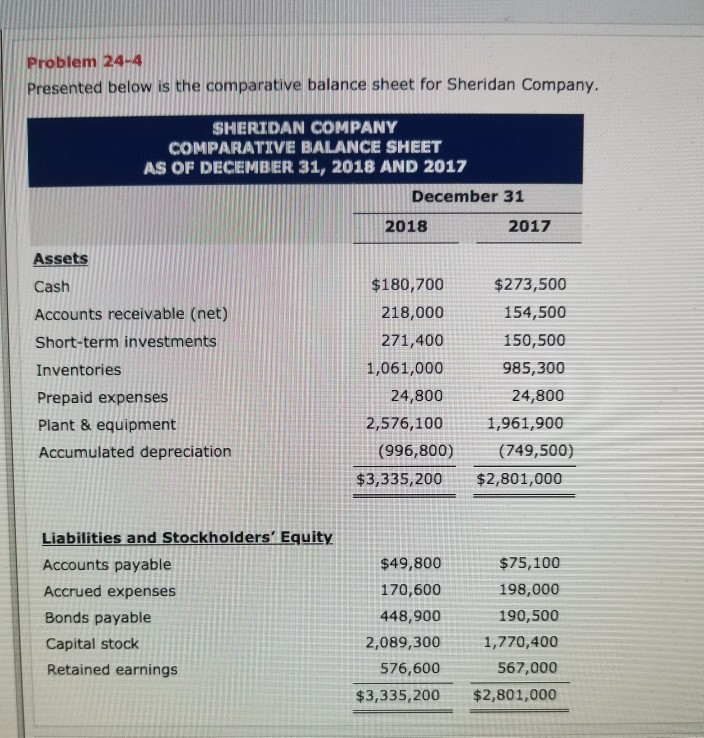
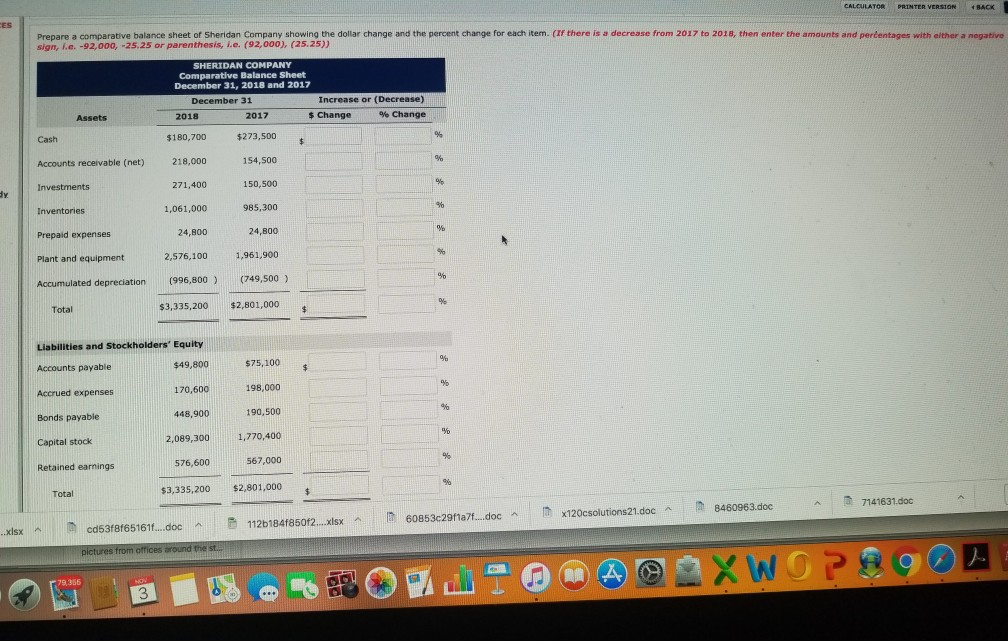
Problem 24-4 Presented below is the comparative balance sheet for Sheridan Company. SHERIDAN COMPANY COMPARATIVE BALANCE SHEET AS OF DECEMBER 31, 2018 AND 2017 December 31 2018 2017 Assets Cash Accounts receivable (net) Short-term investments Inventories Prepaid expenses Plant & equipment Accumulated depreciation 180,700$273,500 154,500 150,500 985,300 24,800 2,576,1001,961,900 218,000 271,400 1,061,000 24,800 (996,800) (749,500) $3,335,200 2,801,000 Liabilities and Stockholders' Equity Accounts payable Accrued expenses Bonds payable Capital stock Retained earnings $49,800 170,600 448,900 $75,100 198,000 190,500 2,089,3001,770,400 567,000 $3,335,200 $2,801,000 576,600
Step by Step Solution
There are 3 Steps involved in it

Get step-by-step solutions from verified subject matter experts