

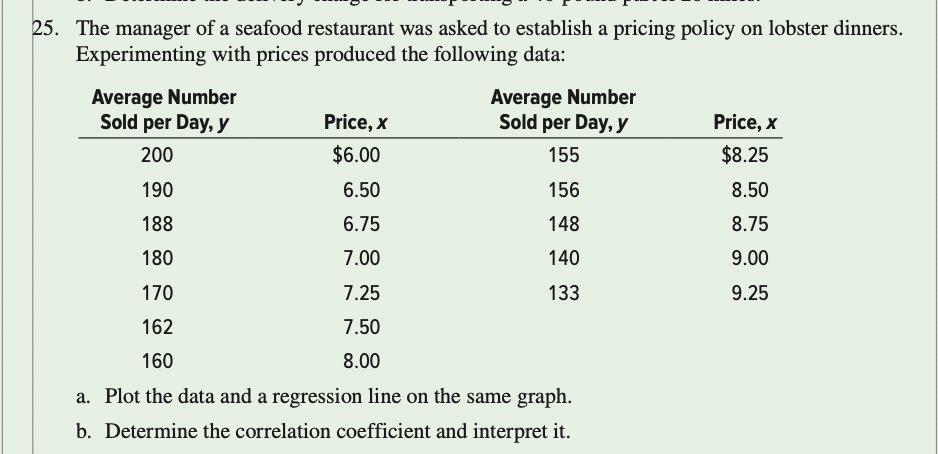
Question: Problem #25: Complete in Excel as much as possible Please. The manager of a seafood restaurant was asked to establish a pricing policy on lobster
Problem #25: Complete in Excel as much as possible Please.
Step by Step Solution
There are 3 Steps involved in it
1 Expert Approved Answer
Step: 1 Unlock

Question Has Been Solved by an Expert!
Get step-by-step solutions from verified subject matter experts
Step: 2 Unlock
Step: 3 Unlock