

Question: Problem 28 (Ratio Computation and Analysis) The following data are available for MNO Printing Co MNO Printing Co. Balance Sheet December 31, 20X2 and 20X1
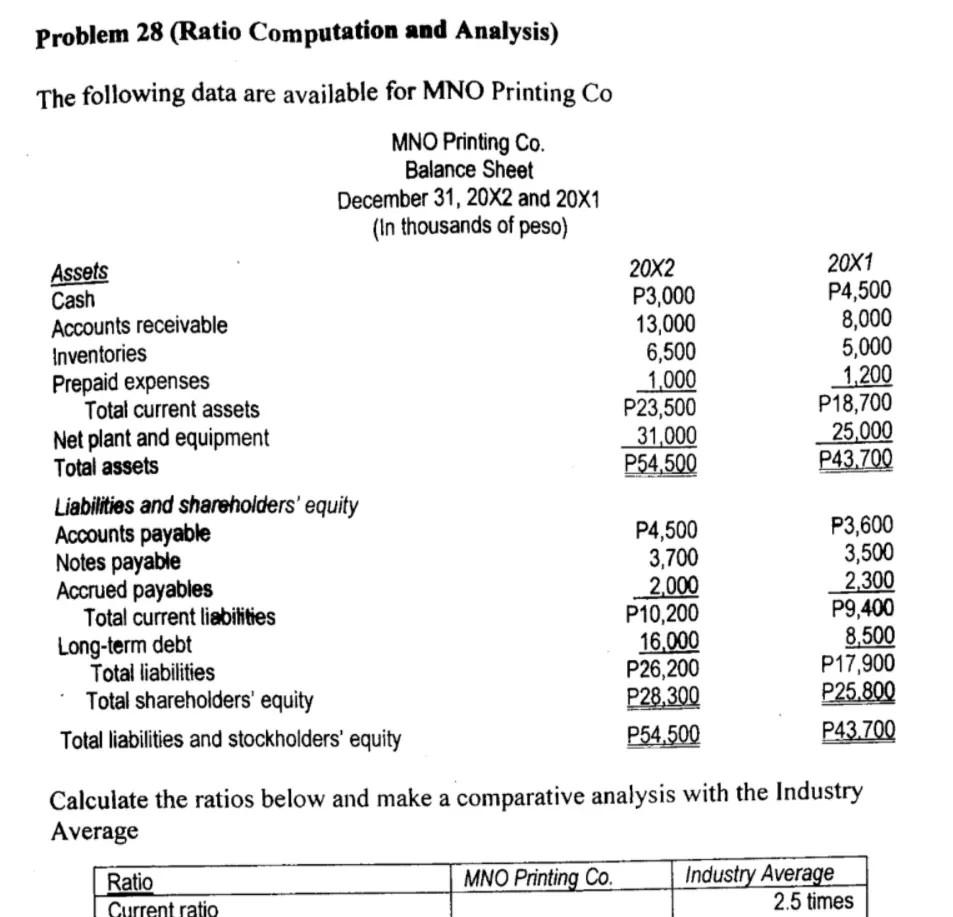
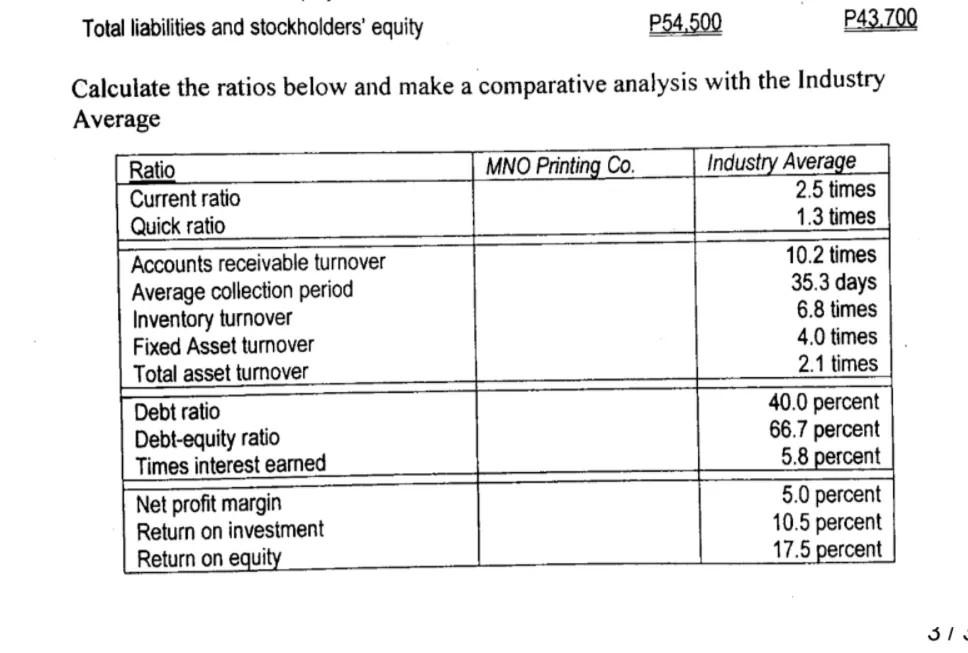
Problem 28 (Ratio Computation and Analysis) The following data are available for MNO Printing Co MNO Printing Co. Balance Sheet December 31, 20X2 and 20X1 (In thousands of peso) Assets Cash Accounts receivable Inventories Prepaid expenses Total current assets Net plant and equipment Total assets 20X2 P3,000 13,000 6,500 1,000 P23,500 31,000 P54,500 20X1 P4,500 8,000 5,000 1.200 P18,700 25,000 P43.700 Liabilities and shareholders' equity Accounts payable Notes payable Accrued payables Total current liabilities Long-term debt Total liabilities Total shareholders' equity Total liabilities and stockholders' equity P4,500 3,700 2.000 P10,200 16.000 P26,200 P28.300 P54,500 P3,600 3,500 2.300 P9,400 8,500 P17,900 P25.800 P43.700 Calculate the ratios below and make a comparative analysis with the Industry Average MNO Printing Co. Ratio Current ratio Industry Average 2.5 times Total liabilities and stockholders' equity P54.500 P43.700 Calculate the ratios below and make a comparative analysis with the Industry Average Ratio MNO Printing Co. Industry Average Current ratio 2.5 times Quick ratio 1.3 times Accounts receivable turnover 10.2 times 35.3 days Average collection period 6.8 times Inventory turnover Fixed Asset turnover 4.0 times Total asset turnover 2.1 times Debt ratio 40.0 percent Debt-equity ratio 66.7 percent Times interest earned 5.8 percent Net profit margin 5.0 percent Return on investment 10.5 percent Return on equity 17.5 percent 31
Step by Step Solution
There are 3 Steps involved in it

Get step-by-step solutions from verified subject matter experts