

Question: Problem 3. (10 pts) Using Matlab, Python, Excel or other plotting software of your choice, calculate and plot a graph similar to the plot below.
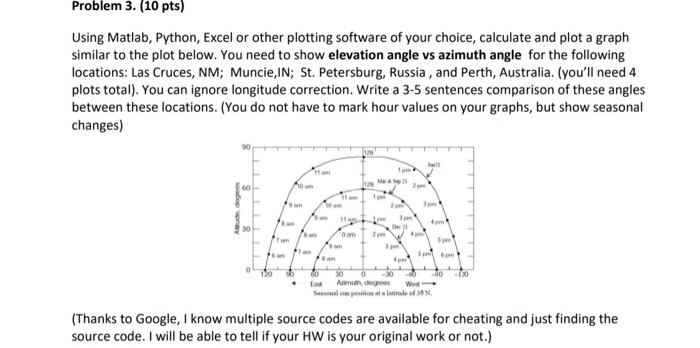
Problem 3. (10 pts) Using Matlab, Python, Excel or other plotting software of your choice, calculate and plot a graph similar to the plot below. You need to show elevation angle vs azimuth angle for the following locations: Las Cruces, NM; Muncie, IN; St. Petersburg, Russia, and Perth, Australia. (you'll need 4 plots total). You can ignore longitude correction. Write a 3-5 sentences comparison of these angles between these locations. (You do not have to mark hour values on your graphs, but show seasonal changes) 4 F Se Am degrees We position at a latitude of 30 N (Thanks to Google, I know multiple source codes are available for cheating and just finding the source code. I will be able to tell if your HW is your original work or not.) Problem 3. (10 pts) Using Matlab, Python, Excel or other plotting software of your choice, calculate and plot a graph similar to the plot below. You need to show elevation angle vs azimuth angle for the following locations: Las Cruces, NM; Muncie, IN; St. Petersburg, Russia, and Perth, Australia. (you'll need 4 plots total). You can ignore longitude correction. Write a 3-5 sentences comparison of these angles between these locations. (You do not have to mark hour values on your graphs, but show seasonal changes) 4 F Se Am degrees We position at a latitude of 30 N (Thanks to Google, I know multiple source codes are available for cheating and just finding the source code. I will be able to tell if your HW is your original work or not.)
Step by Step Solution
There are 3 Steps involved in it

Get step-by-step solutions from verified subject matter experts