

Question: Problem 3: 15 points = [8 + 7] Registrar's Office team members compare students' performance using large samples from two groups. Group I included n1
![Problem 3: 15 points = [8 + 7] Registrar's Office team](https://s3.amazonaws.com/si.experts.images/answers/2024/06/66781e01969c7_03366781e015947b.jpg)
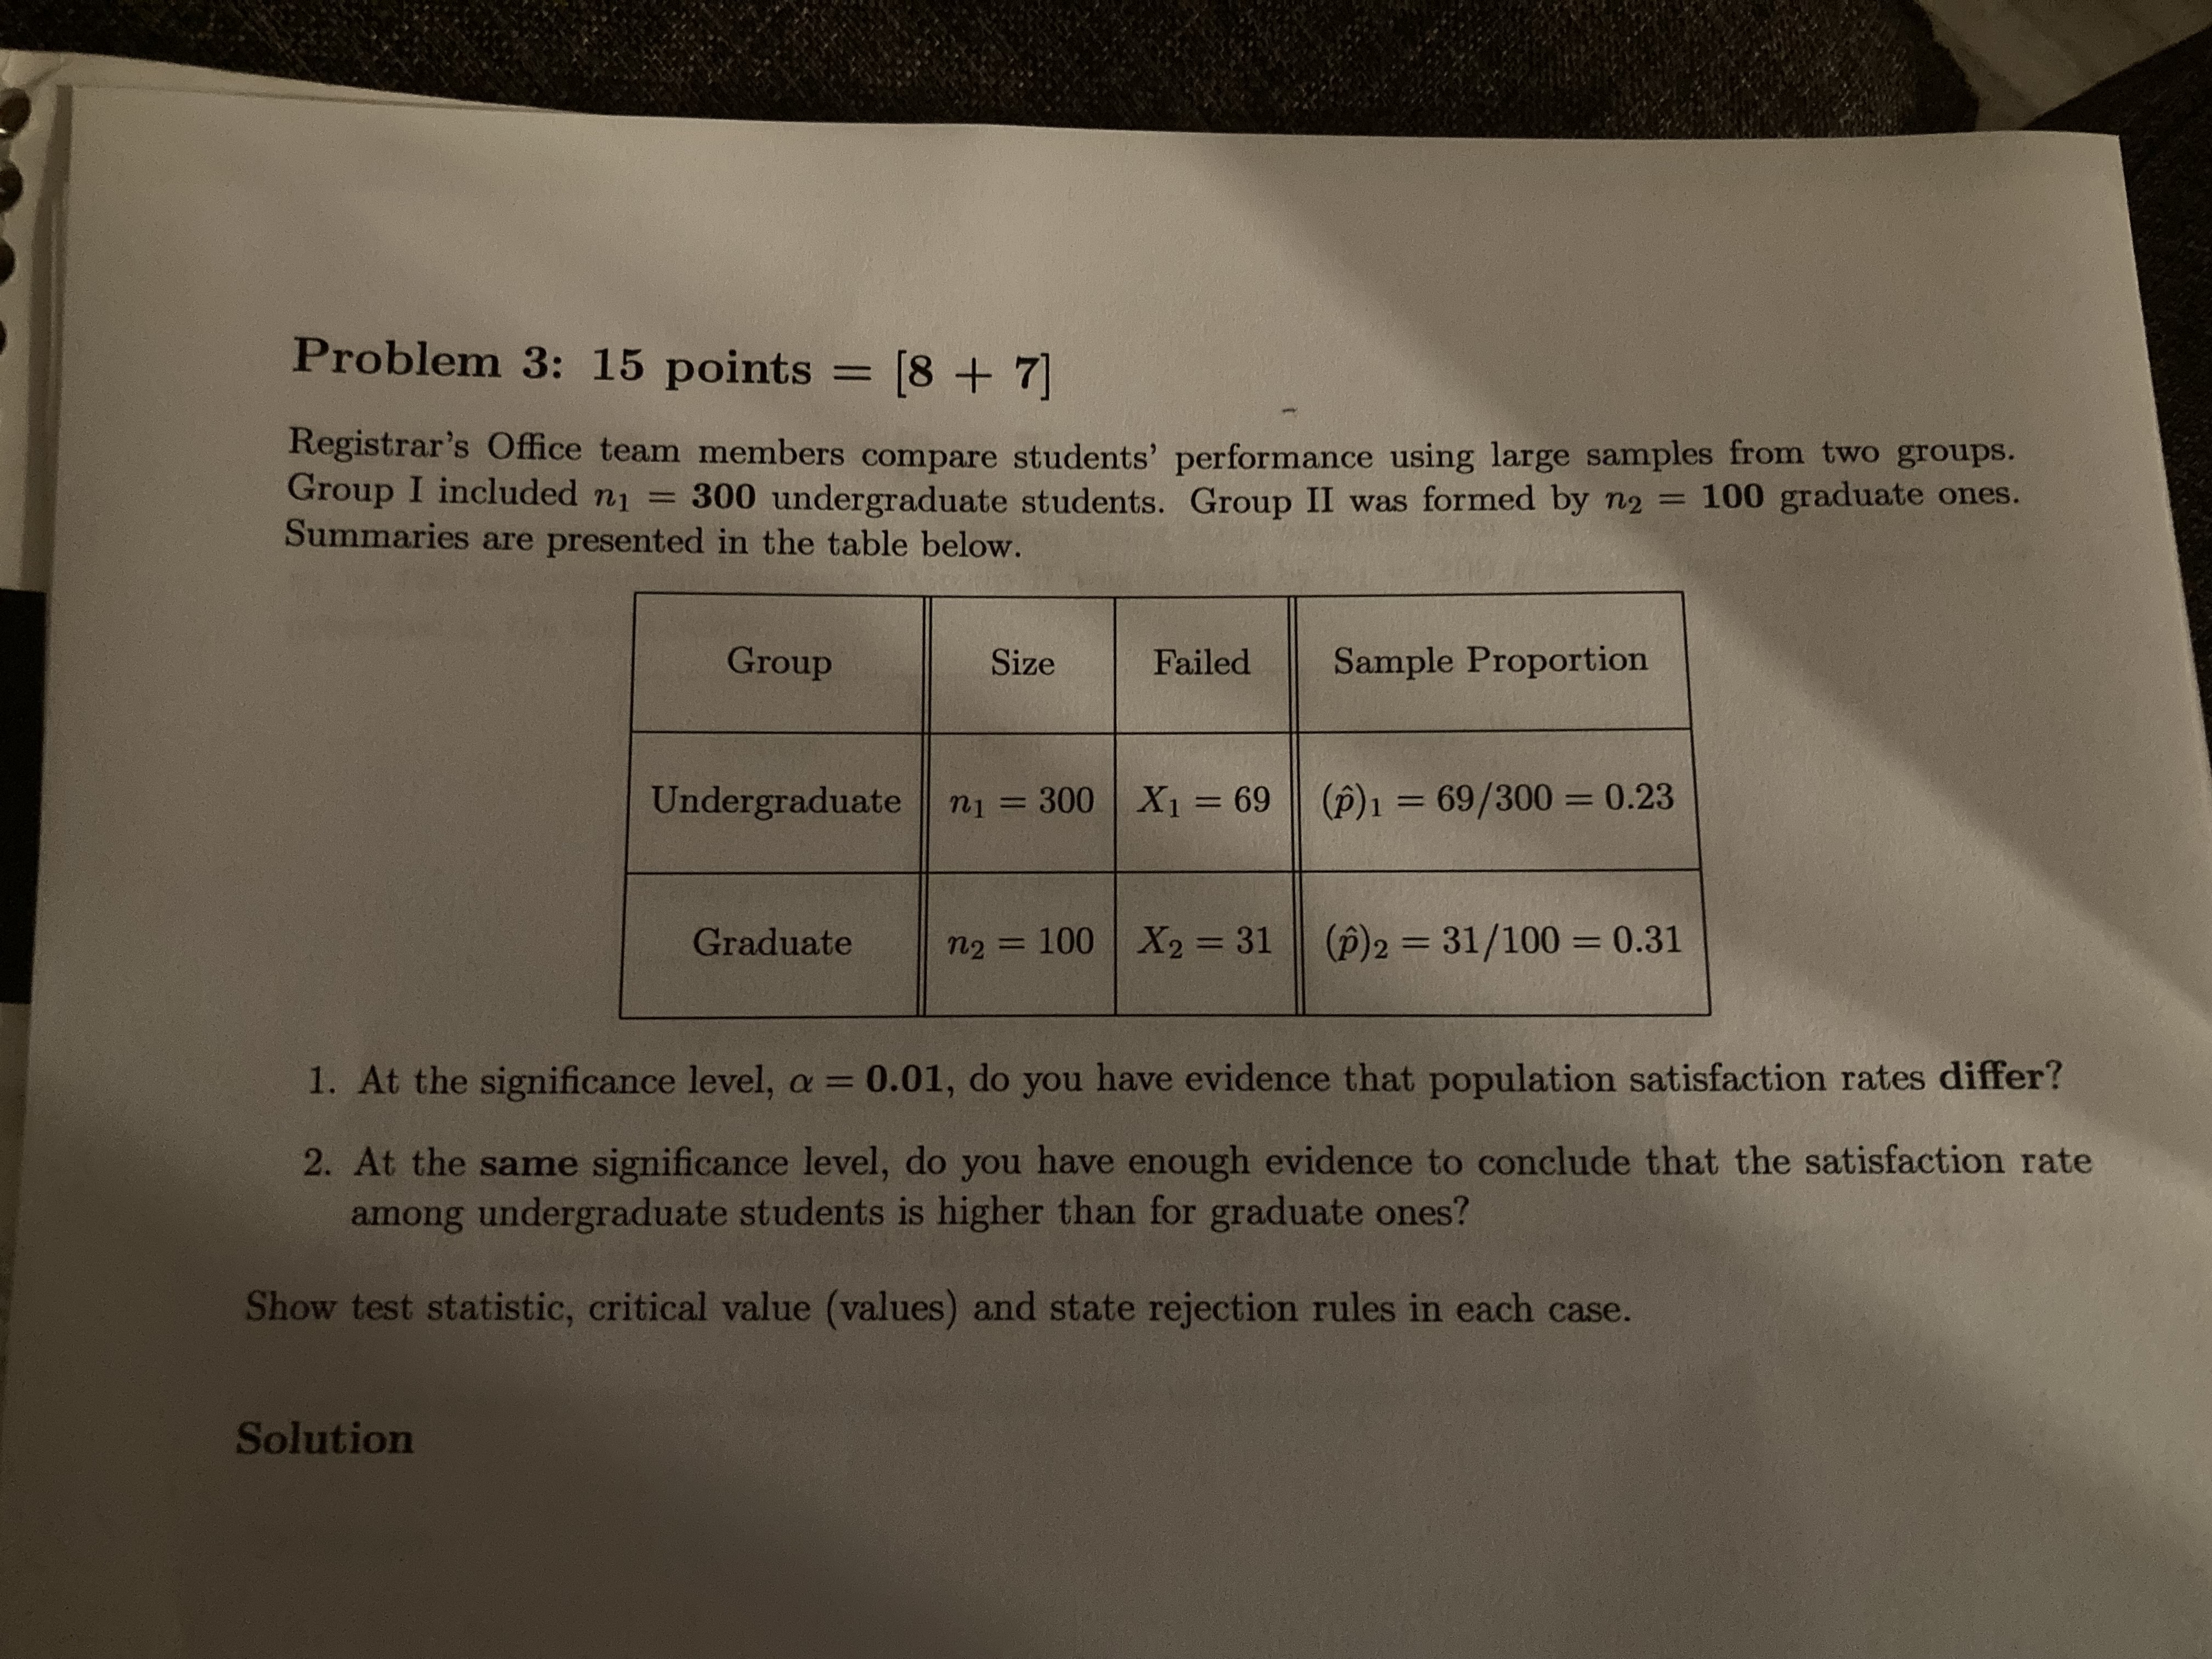
Problem 3: 15 points = [8 + 7] Registrar's Office team members compare students' performance using large samples from two groups. Group I included n1 = 300 undergraduate students. Group II was formed by n2 = 100 graduate ones. Summaries are presented in the table below. Group Size Failed Sample Proportion Undergraduate n1 = 300 X1 = 69 (p)1 = 69/300 = 0.23 Graduate n2 = 100 X2 = 31 (p)2 = 31/100 = 0.31 1. At the significance level, a = 0.01, do you have evidence that population satisfaction rates differ? 2. At the same significance level, do you have enough evidence to conclude that the satisfaction rate among undergraduate students is higher than for graduate ones? Show test statistic, critical value (values) and state rejection rules in each case. Solution
Step by Step Solution
There are 3 Steps involved in it

Get step-by-step solutions from verified subject matter experts