

Question: Problem 3. (15 points) A franchiser was interested in determining how many vehicles, on average, pass by the proposed location of a restaurant on
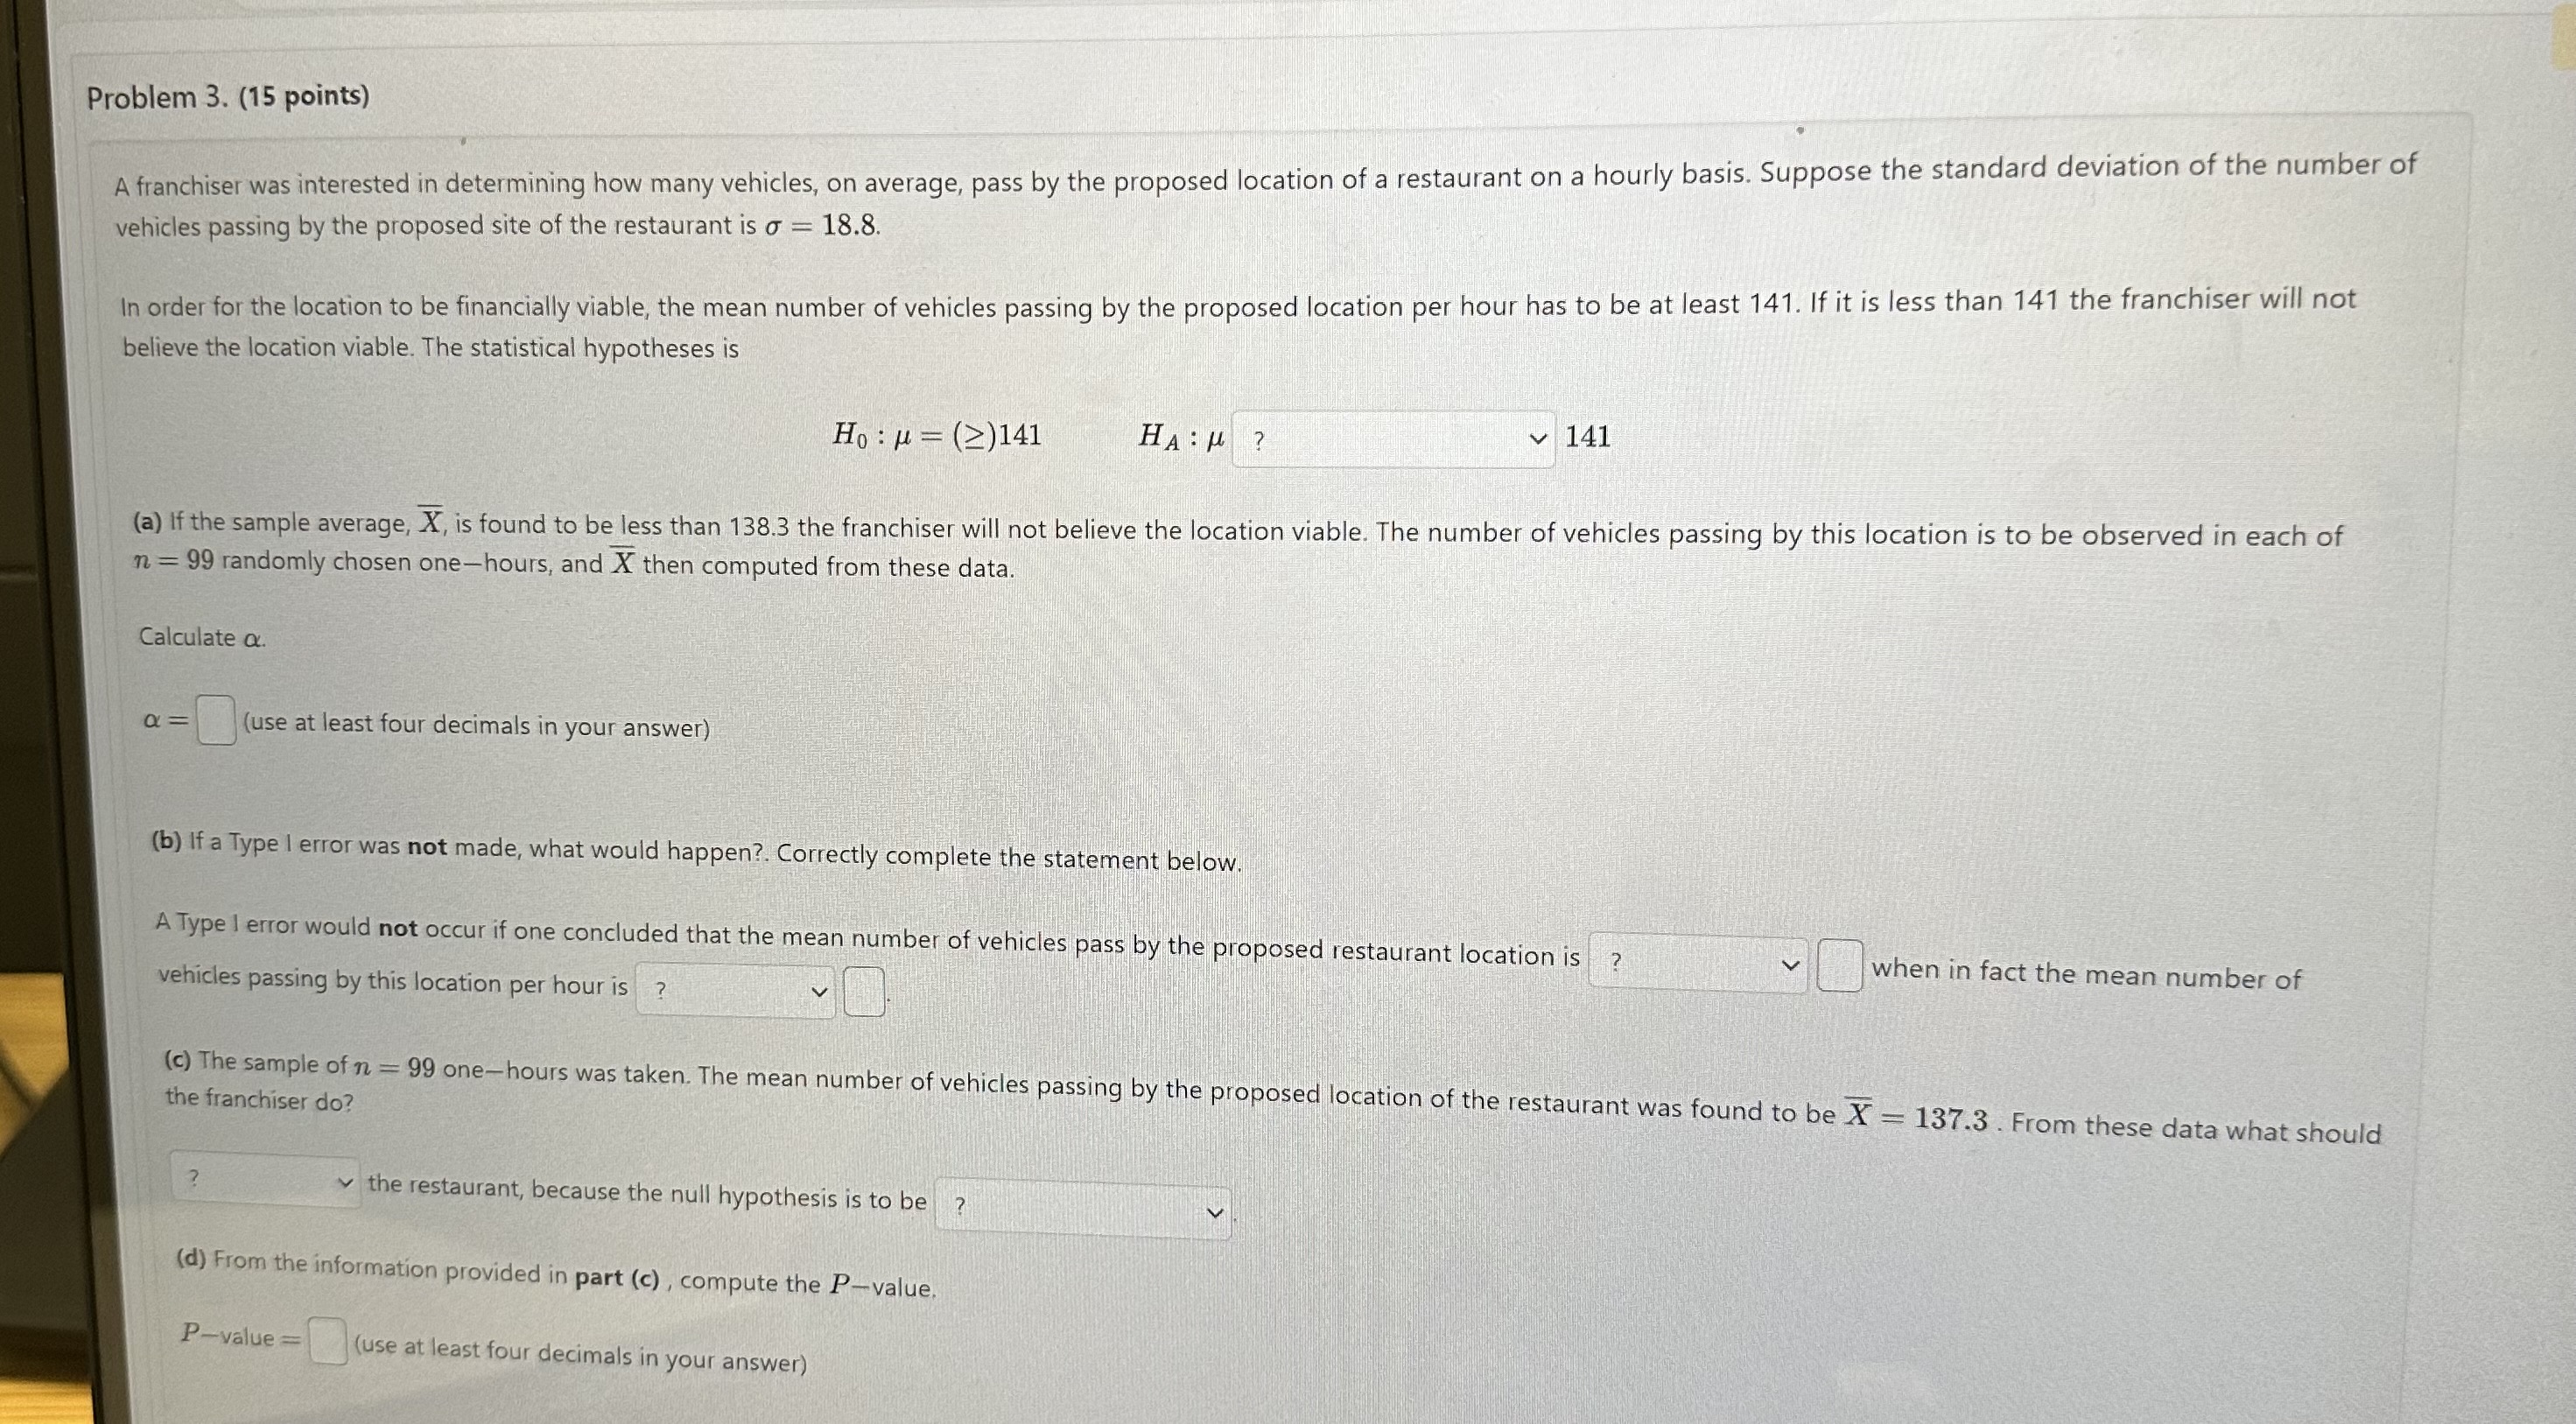
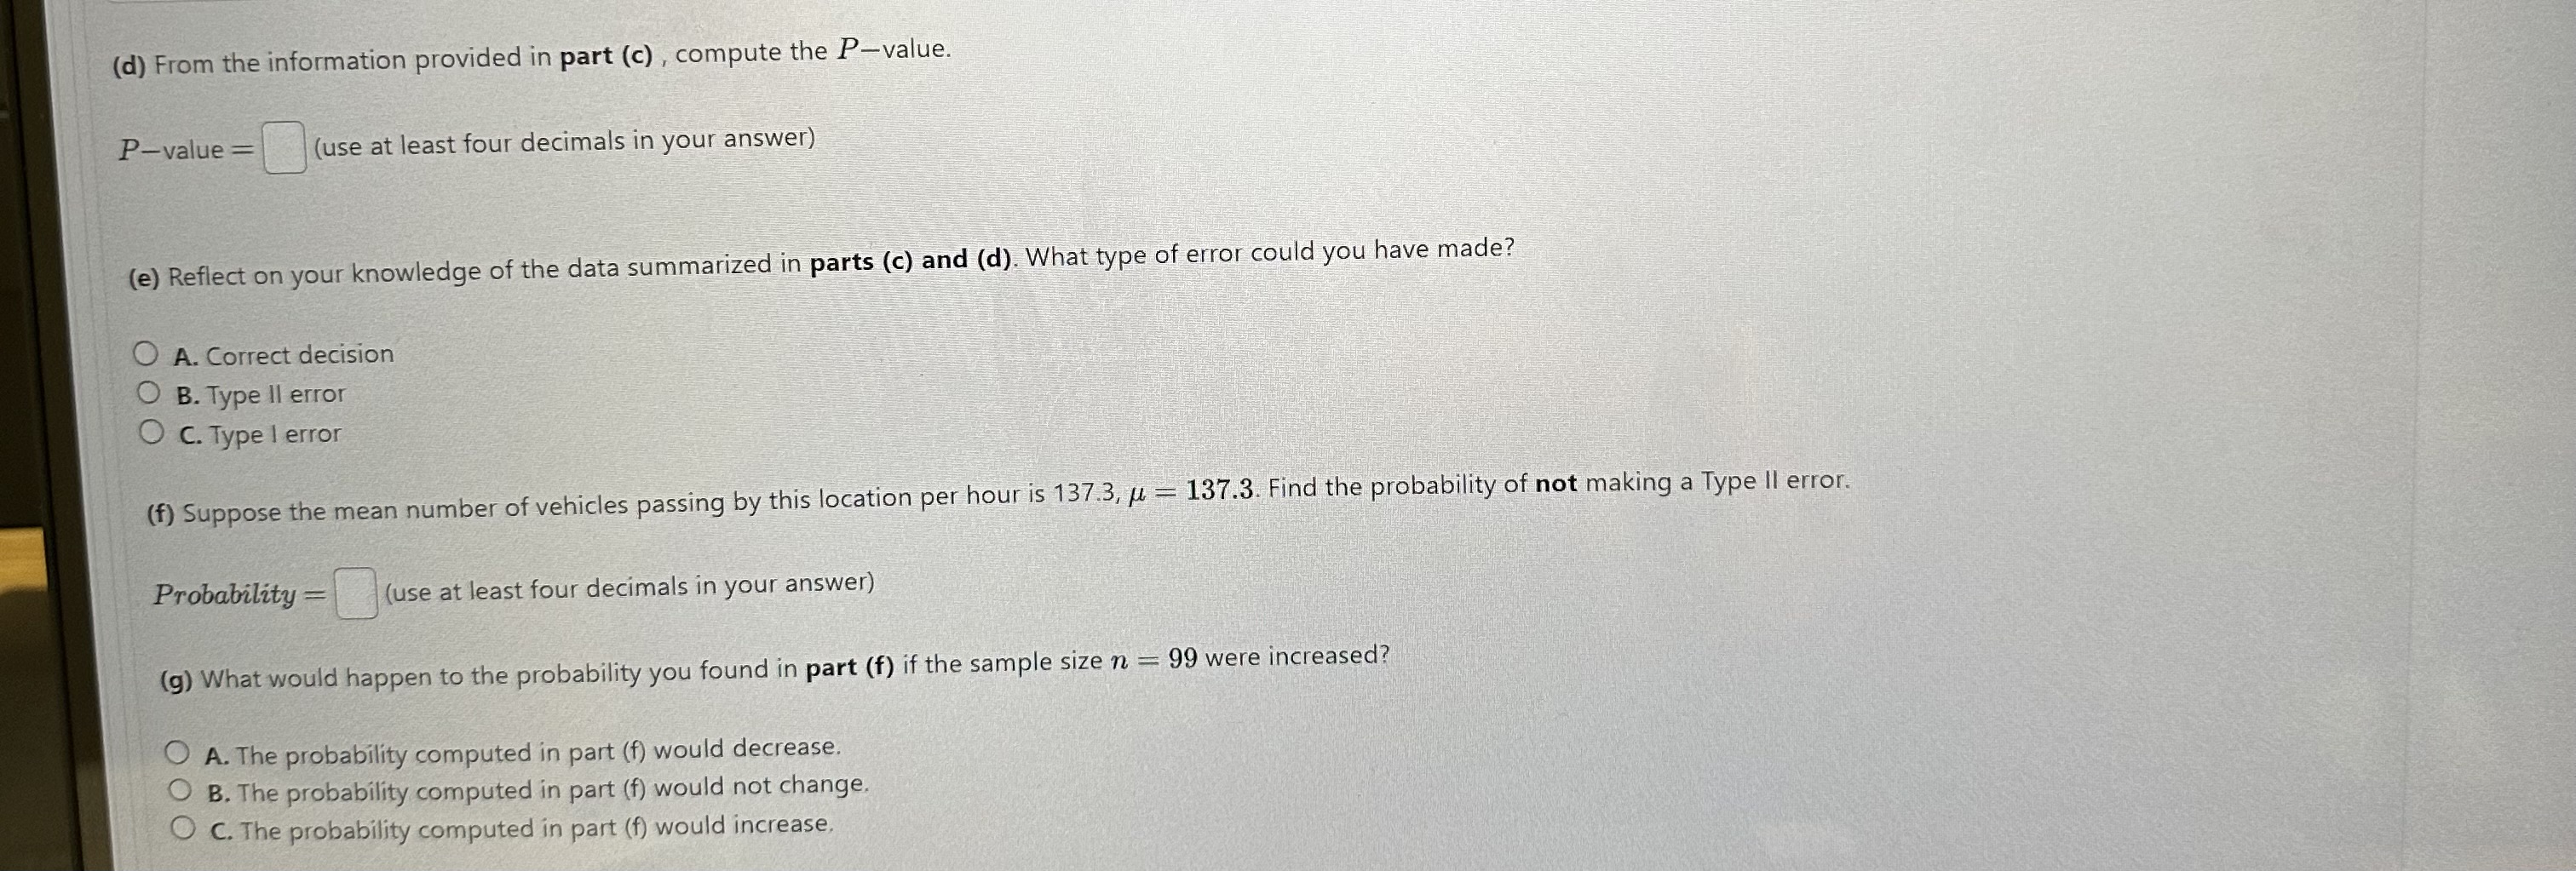
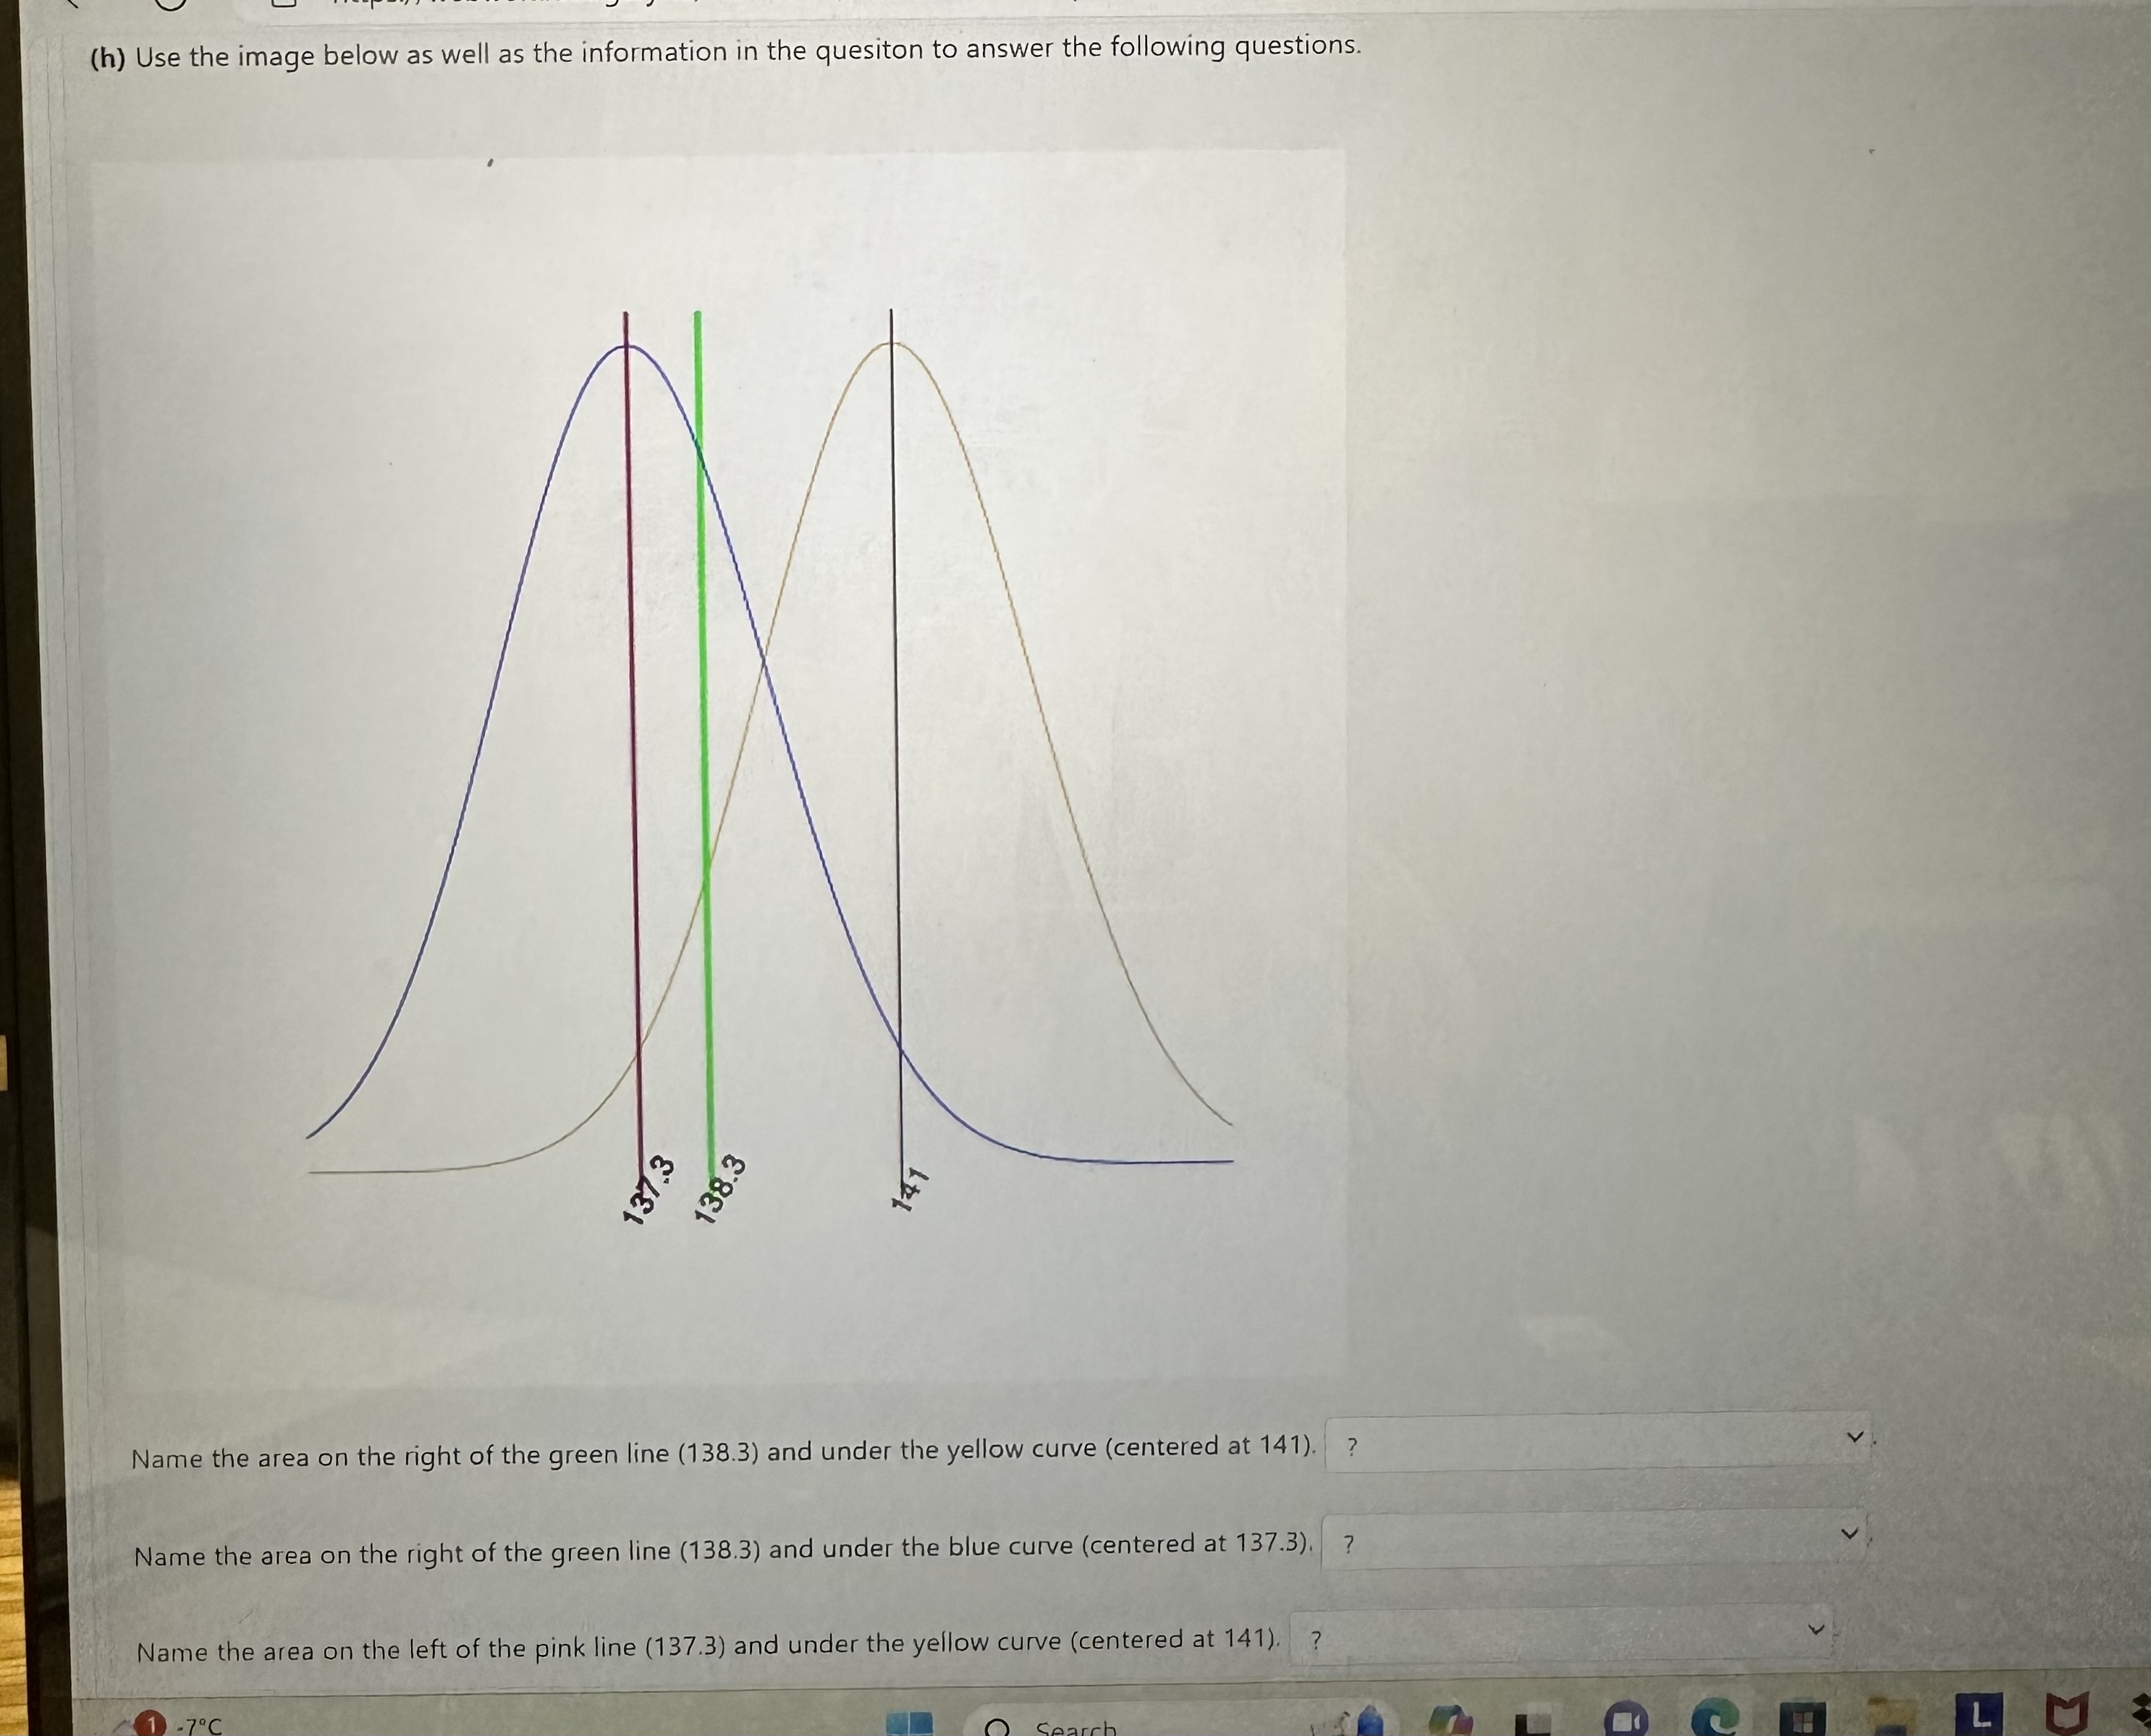
Problem 3. (15 points) A franchiser was interested in determining how many vehicles, on average, pass by the proposed location of a restaurant on a hourly basis. Suppose the standard deviation of the number of vehicles passing by the proposed site of the restaurant is = 18.8. In order for the location to be financially viable, the mean number of vehicles passing by the proposed location per hour has to be at least 141. If it is less than 141 the franchiser will not believe the location viable. The statistical hypotheses is Ho:}=(2)141 HAH? 141 (a) If the sample average, X, is found to be less than 138.3 the franchiser will not believe the location viable. The number of vehicles passing by this location is to be observed in each of 99 randomly chosen one-hours, and X then computed from these data. m= Calculate a. (use at least four decimals in your answer) (b) If a Type I error was not made, what would happen?. Correctly complete the statement below. ? V A Type I error would not occur if one concluded that the mean number of vehicles pass by the proposed restaurant location is ? vehicles passing by this location per hour is when in fact the mean number of - (c) The sample of n = 99 one-hours was taken. The mean number of vehicles passing by the proposed location of the restaurant was found to be X = 137.3. From these data what should the franchiser do? ? the restaurant, because the null hypothesis is to be ? (d) From the information provided in part (c), compute the P-value. P-value= (use at least four decimals in your answer) (d) From the information provided in part (c), compute the P-value. P-value= (use at least four decimals in your answer) (e) Reflect on your knowledge of the data summarized in parts (c) and (d). What type of error could you have made? A. Correct decision B. Type II error O C. Type I error (f) Suppose the mean number of vehicles passing by this location per hour is 137.3, = 137.3. Find the probability of not making a Type II error. Probability= (use at least four decimals in your answer) (g) What would happen to the probability you found in part (f) if the sample size n = 99 were increased? OA. The probability computed in part (f) would decrease. B. The probability computed in part (f) would not change. OC. The probability computed in part (f) would increase. 1-7C (h) Use the image below as well as the information in the quesiton to answer the following questions. 137.3 138.3 141 Name the area on the right of the green line (138.3) and under the yellow curve (centered at 141). ? Name the area on the right of the green line (138.3) and under the blue curve (centered at 137.3). ? Name the area on the left of the pink line (137.3) and under the yellow curve (centered at 141). ? Search D L
Step by Step Solution
There are 3 Steps involved in it

Get step-by-step solutions from verified subject matter experts