

Question: Problem 3 - 2 1 ( Algo ) The following table shows predicted product demand using your particular forecasting method along with the actual demand
Problem Algo
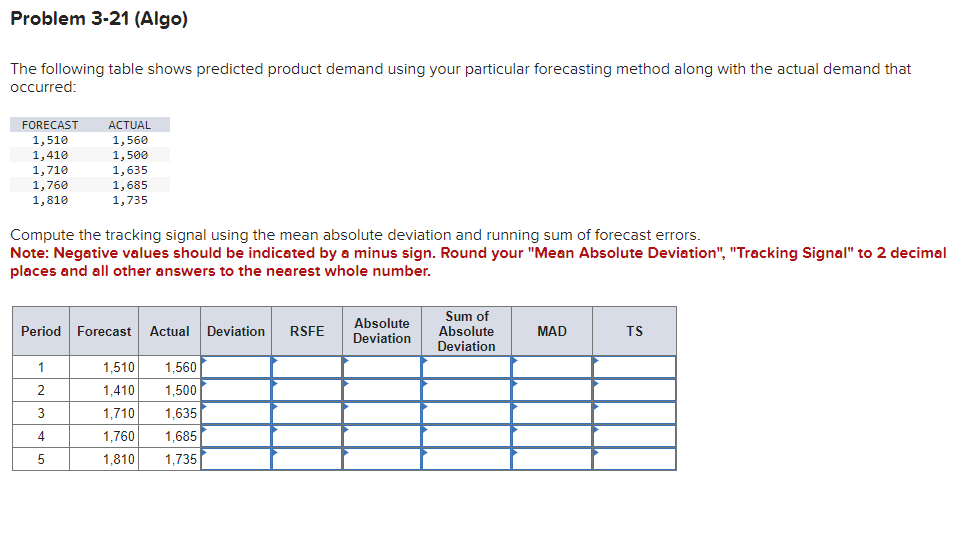
The following table shows predicted product demand using your particular forecasting method along with the actual demand that occurred:
tableFORECASTACTUAL
Compute the tracking signal using the mean absolute deviation and running sum of forecast errors.
Note: Negative values should be indicated by a minus sign. Round your "Mean Absolute Deviation", "Tracking Signal" to decimal places and all other answers to the nearest whole number.
tablePeriodForecast,Actual,Deviation,RSFE,tableAbsoluteDeviationtableSum ofAbsoluteDeviationMAD,TS
Step by Step Solution
There are 3 Steps involved in it
1 Expert Approved Answer
Step: 1 Unlock

Question Has Been Solved by an Expert!
Get step-by-step solutions from verified subject matter experts
Step: 2 Unlock
Step: 3 Unlock