

Question: Problem #3 (4 pts): Complete the following table used for plotting the OC and AOQ curves for a single sampling plan: n=50,c=3. Given that and
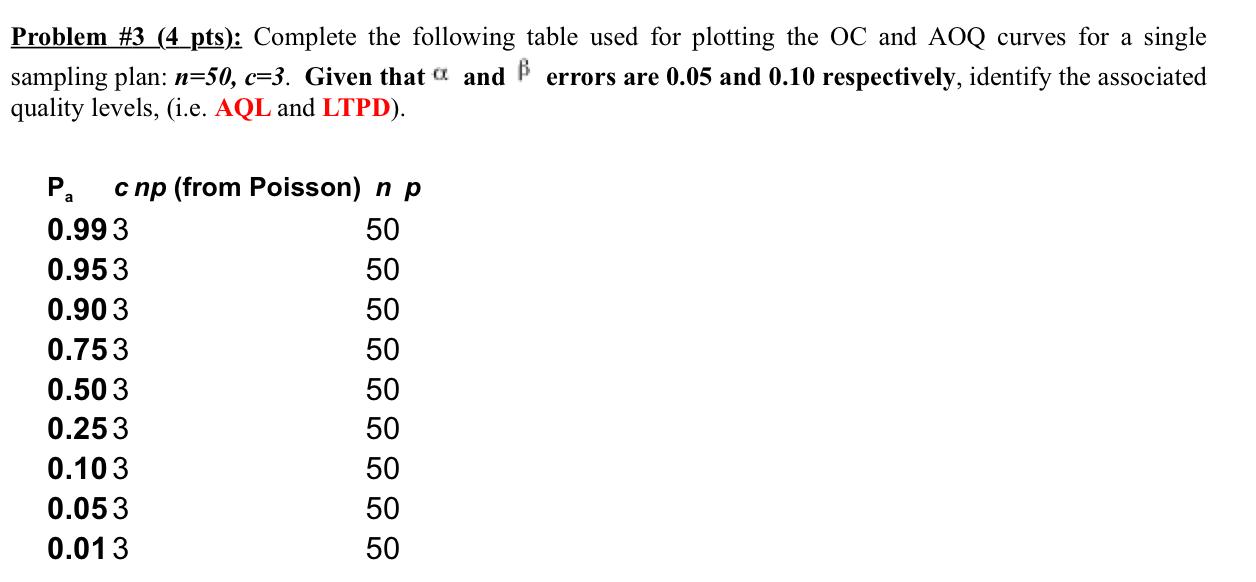
Problem \#3 (4 pts): Complete the following table used for plotting the OC and AOQ curves for a single sampling plan: n=50,c=3. Given that and errors are 0.05 and 0.10 respectively, identify the associated quality levels, (i.e. AQL and LTPD)
Step by Step Solution
There are 3 Steps involved in it
1 Expert Approved Answer
Step: 1 Unlock

Question Has Been Solved by an Expert!
Get step-by-step solutions from verified subject matter experts
Step: 2 Unlock
Step: 3 Unlock