

Question: Problem 3 (40 points) In a factory producing mechanical components 1000 components were measured and statistical analysis resulted in the following table Statistical Class
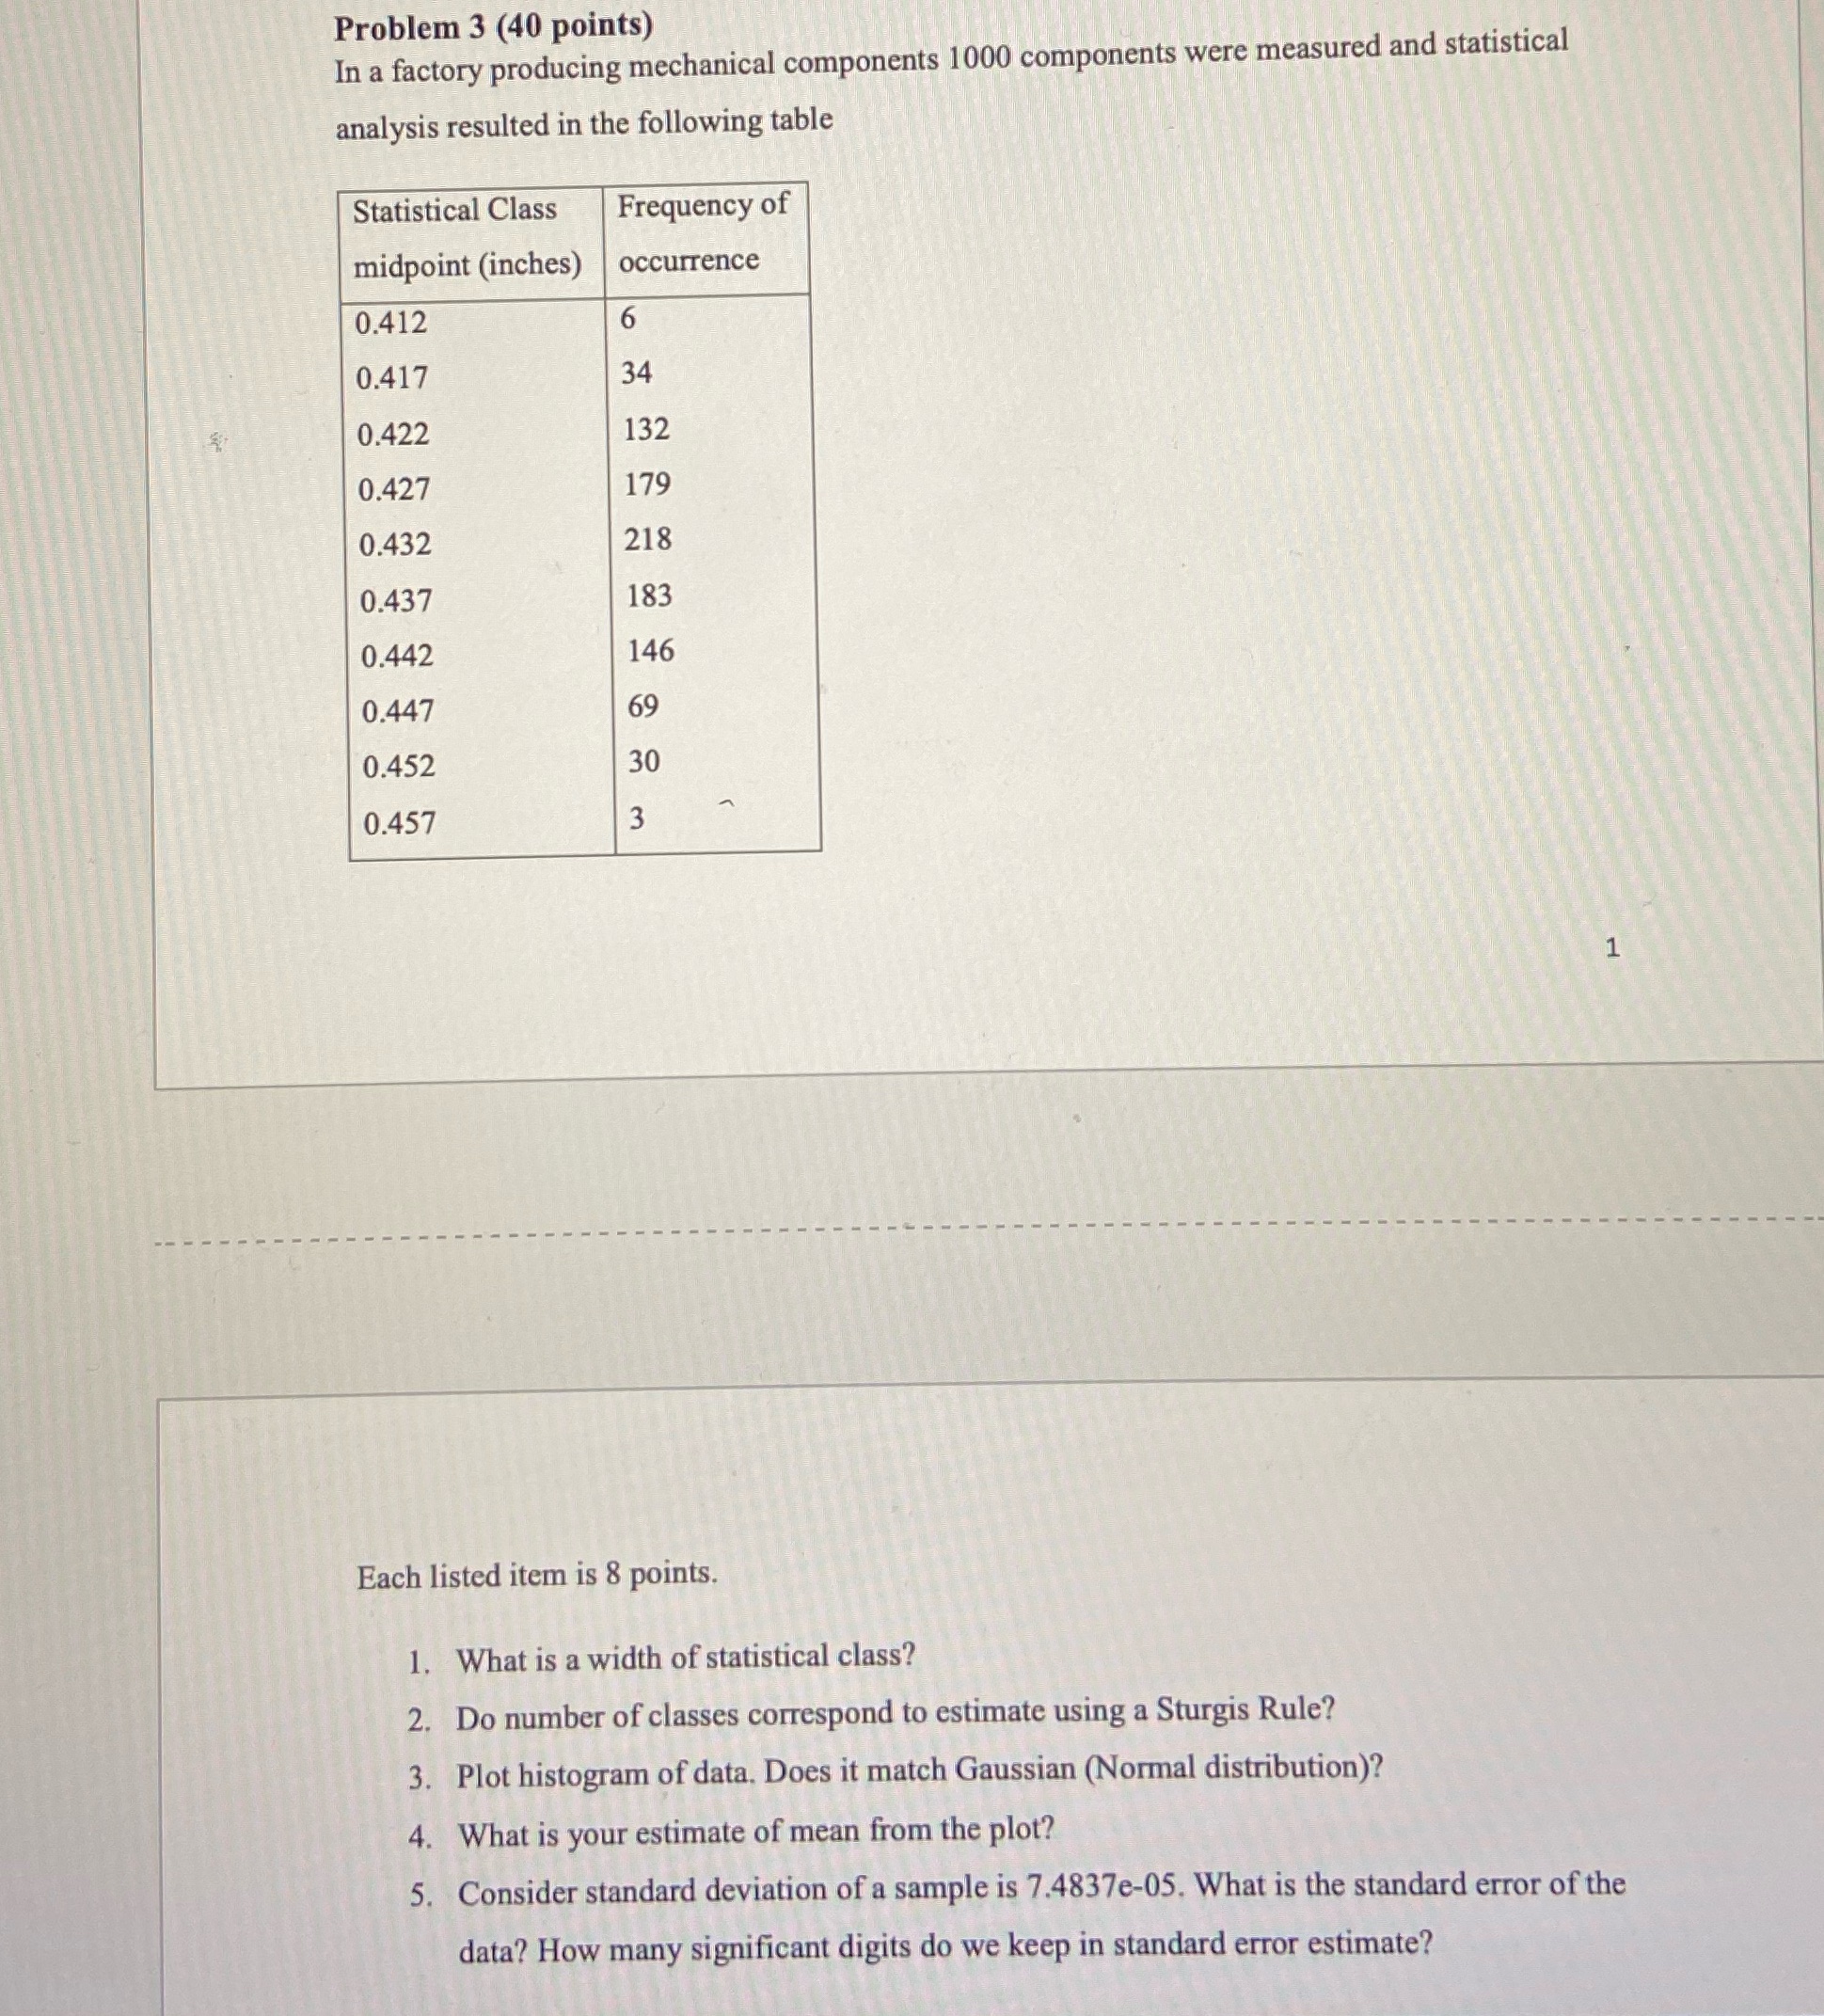
Problem 3 (40 points) In a factory producing mechanical components 1000 components were measured and statistical analysis resulted in the following table Statistical Class Frequency of midpoint (inches) occurrence 0.412 6 0.417 34 34 0.422 132 0.427 179 0.432 218 0.437 183 0.442 146 0.447 69 0.452 30 0.457 3 Each listed item is 8 points. 1. What is a width of statistical class? 2. Do number of classes correspond to estimate using a Sturgis Rule? 3. Plot histogram of data. Does it match Gaussian (Normal distribution)? 4. What is your estimate of mean from the plot? 5. Consider standard deviation of a sample is 7.4837e-05. What is the standard error of the data? How many significant digits do we keep in standard error estimate? 1
Step by Step Solution
There are 3 Steps involved in it

Get step-by-step solutions from verified subject matter experts