Question: Problem 3 (40 points): Suppose that you need to decide which of the three available options to invest in. The table below gives the information
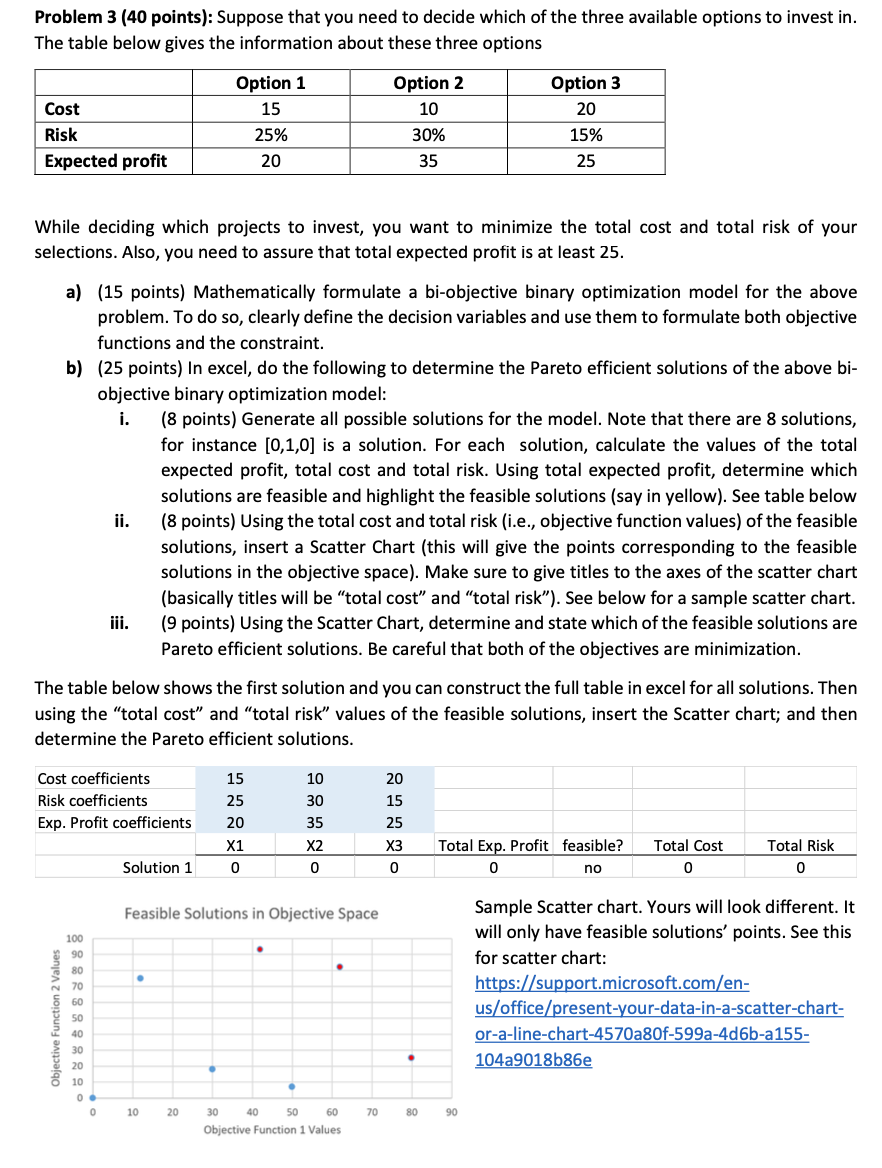
Problem 3 (40 points): Suppose that you need to decide which of the three available options to invest in. The table below gives the information about these three options Cost Risk Expected profit Option 1 15 25% 20 Option 2 10 30% Option 3 20 15% 25 35 While deciding which projects to invest, you want to minimize the total cost and total risk of your selections. Also, you need to assure that total expected profit is at least 25. a) (15 points) Mathematically formulate a bi-objective binary optimization model for the above problem. To do so, clearly define the decision variables and use them to formulate both objective functions and the constraint. b) (25 points) In excel, do the following to determine the Pareto efficient solutions of the above bi- objective binary optimization model: i. (8 points) Generate all possible solutions for the model. Note that there are 8 solutions, for instance [0,1,0] is a solution. For each solution, calculate the values of the total expected profit, total cost and total risk. Using total expected profit, determine which solutions are feasible and highlight the feasible solutions (say in yellow). See table below ii. (8 points) Using the total cost and total risk (i.e., objective function values) of the feasible solutions, insert a Scatter Chart (this will give the points corresponding to the feasible solutions in the objective space). Make sure to give titles to the axes of the scatter chart (basically titles will be "total cost" and "total risk). See below for a sample scatter chart. iii. (9 points) Using the Scatter Chart, determine and state which of the feasible solutions are Pareto efficient solutions. Be careful that both of the objectives are minimization. The table below shows the first solution and you can construct the full table in excel for all solutions. Then using the "total cost" and "total risk" values of the feasible solutions, insert the Scatter chart; and then determine the Pareto efficient solutions. 15 10 20 Cost coefficients Risk coefficients Exp. Profit coefficients 25 30 15 20 X1 35 X2 0 25 X3 0 Total Exp. Profit feasible? 0 no Total Cost 0 Total Risk 0 Solution 1 0 Feasible Solutions in Objective Space 100 90 80 70 . Sample Scatter chart. Yours will look different. It will only have feasible solutions' points. See this for scatter chart: https://support.microsoft.com/en- us/office/present-your-data-in-a-scatter-chart- or-a-line-chart-4570a80f-599a-4d6b-a155- 104a9018b86e 60 Objective Function 2 Values 50 40 . . 30 20 10 0 0 10 20 70 80 90 30 40 50 60 Objective Function 1 Values Problem 3 (40 points): Suppose that you need to decide which of the three available options to invest in. The table below gives the information about these three options Cost Risk Expected profit Option 1 15 25% 20 Option 2 10 30% Option 3 20 15% 25 35 While deciding which projects to invest, you want to minimize the total cost and total risk of your selections. Also, you need to assure that total expected profit is at least 25. a) (15 points) Mathematically formulate a bi-objective binary optimization model for the above problem. To do so, clearly define the decision variables and use them to formulate both objective functions and the constraint. b) (25 points) In excel, do the following to determine the Pareto efficient solutions of the above bi- objective binary optimization model: i. (8 points) Generate all possible solutions for the model. Note that there are 8 solutions, for instance [0,1,0] is a solution. For each solution, calculate the values of the total expected profit, total cost and total risk. Using total expected profit, determine which solutions are feasible and highlight the feasible solutions (say in yellow). See table below ii. (8 points) Using the total cost and total risk (i.e., objective function values) of the feasible solutions, insert a Scatter Chart (this will give the points corresponding to the feasible solutions in the objective space). Make sure to give titles to the axes of the scatter chart (basically titles will be "total cost" and "total risk). See below for a sample scatter chart. iii. (9 points) Using the Scatter Chart, determine and state which of the feasible solutions are Pareto efficient solutions. Be careful that both of the objectives are minimization. The table below shows the first solution and you can construct the full table in excel for all solutions. Then using the "total cost" and "total risk" values of the feasible solutions, insert the Scatter chart; and then determine the Pareto efficient solutions. 15 10 20 Cost coefficients Risk coefficients Exp. Profit coefficients 25 30 15 20 X1 35 X2 0 25 X3 0 Total Exp. Profit feasible? 0 no Total Cost 0 Total Risk 0 Solution 1 0 Feasible Solutions in Objective Space 100 90 80 70 . Sample Scatter chart. Yours will look different. It will only have feasible solutions' points. See this for scatter chart: https://support.microsoft.com/en- us/office/present-your-data-in-a-scatter-chart- or-a-line-chart-4570a80f-599a-4d6b-a155- 104a9018b86e 60 Objective Function 2 Values 50 40 . . 30 20 10 0 0 10 20 70 80 90 30 40 50 60 Objective Function 1 Values


