

Question: Problem 3. A) Consider the time-varying process behavior shown below. What is the reflection on chart and R chart for each of these several patterns
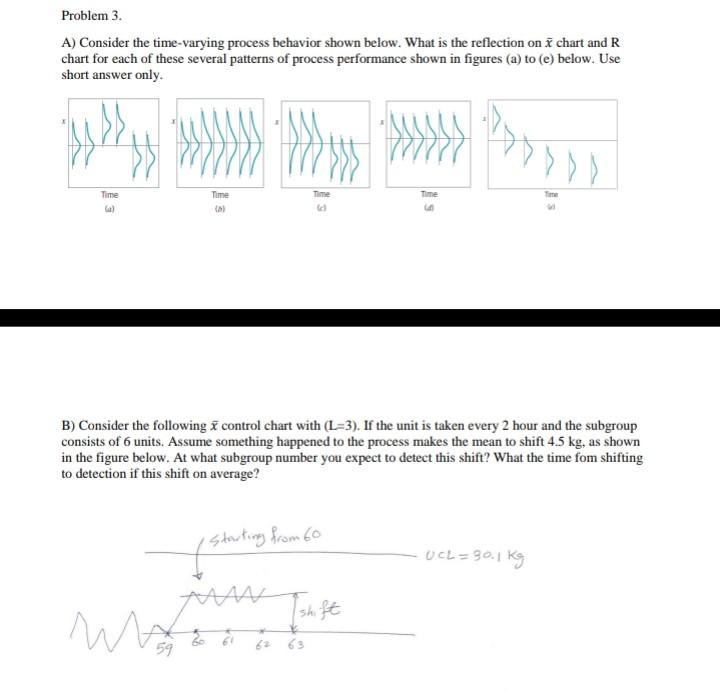
Problem 3. A) Consider the time-varying process behavior shown below. What is the reflection on chart and R chart for each of these several patterns of process performance shown in figures (a) to (e) below. Use short answer only. Time Time Time Time Time Gal B) Consider the following x control chart with (L=3). If the unit is taken every 2 hour and the subgroup consists of 6 units. Assume something happened to the process makes the mean to shift 4.5 kg, as shown in the figure below. At what subgroup number you expect to detect this shift? What the time fom shifting to detection if this shift on average? Starting from 60 UCL = 30.1 kg At WA Ishift 63
Step by Step Solution
There are 3 Steps involved in it
1 Expert Approved Answer
Step: 1 Unlock

Question Has Been Solved by an Expert!
Get step-by-step solutions from verified subject matter experts
Step: 2 Unlock
Step: 3 Unlock