

Question: Problem # 3, a-d. please draw venn diagrams, and write legibly Problem 3: Give your answer as a fraction (no need to reduce). The table
Problem # 3, a-d. please draw venn diagrams, and write legibly
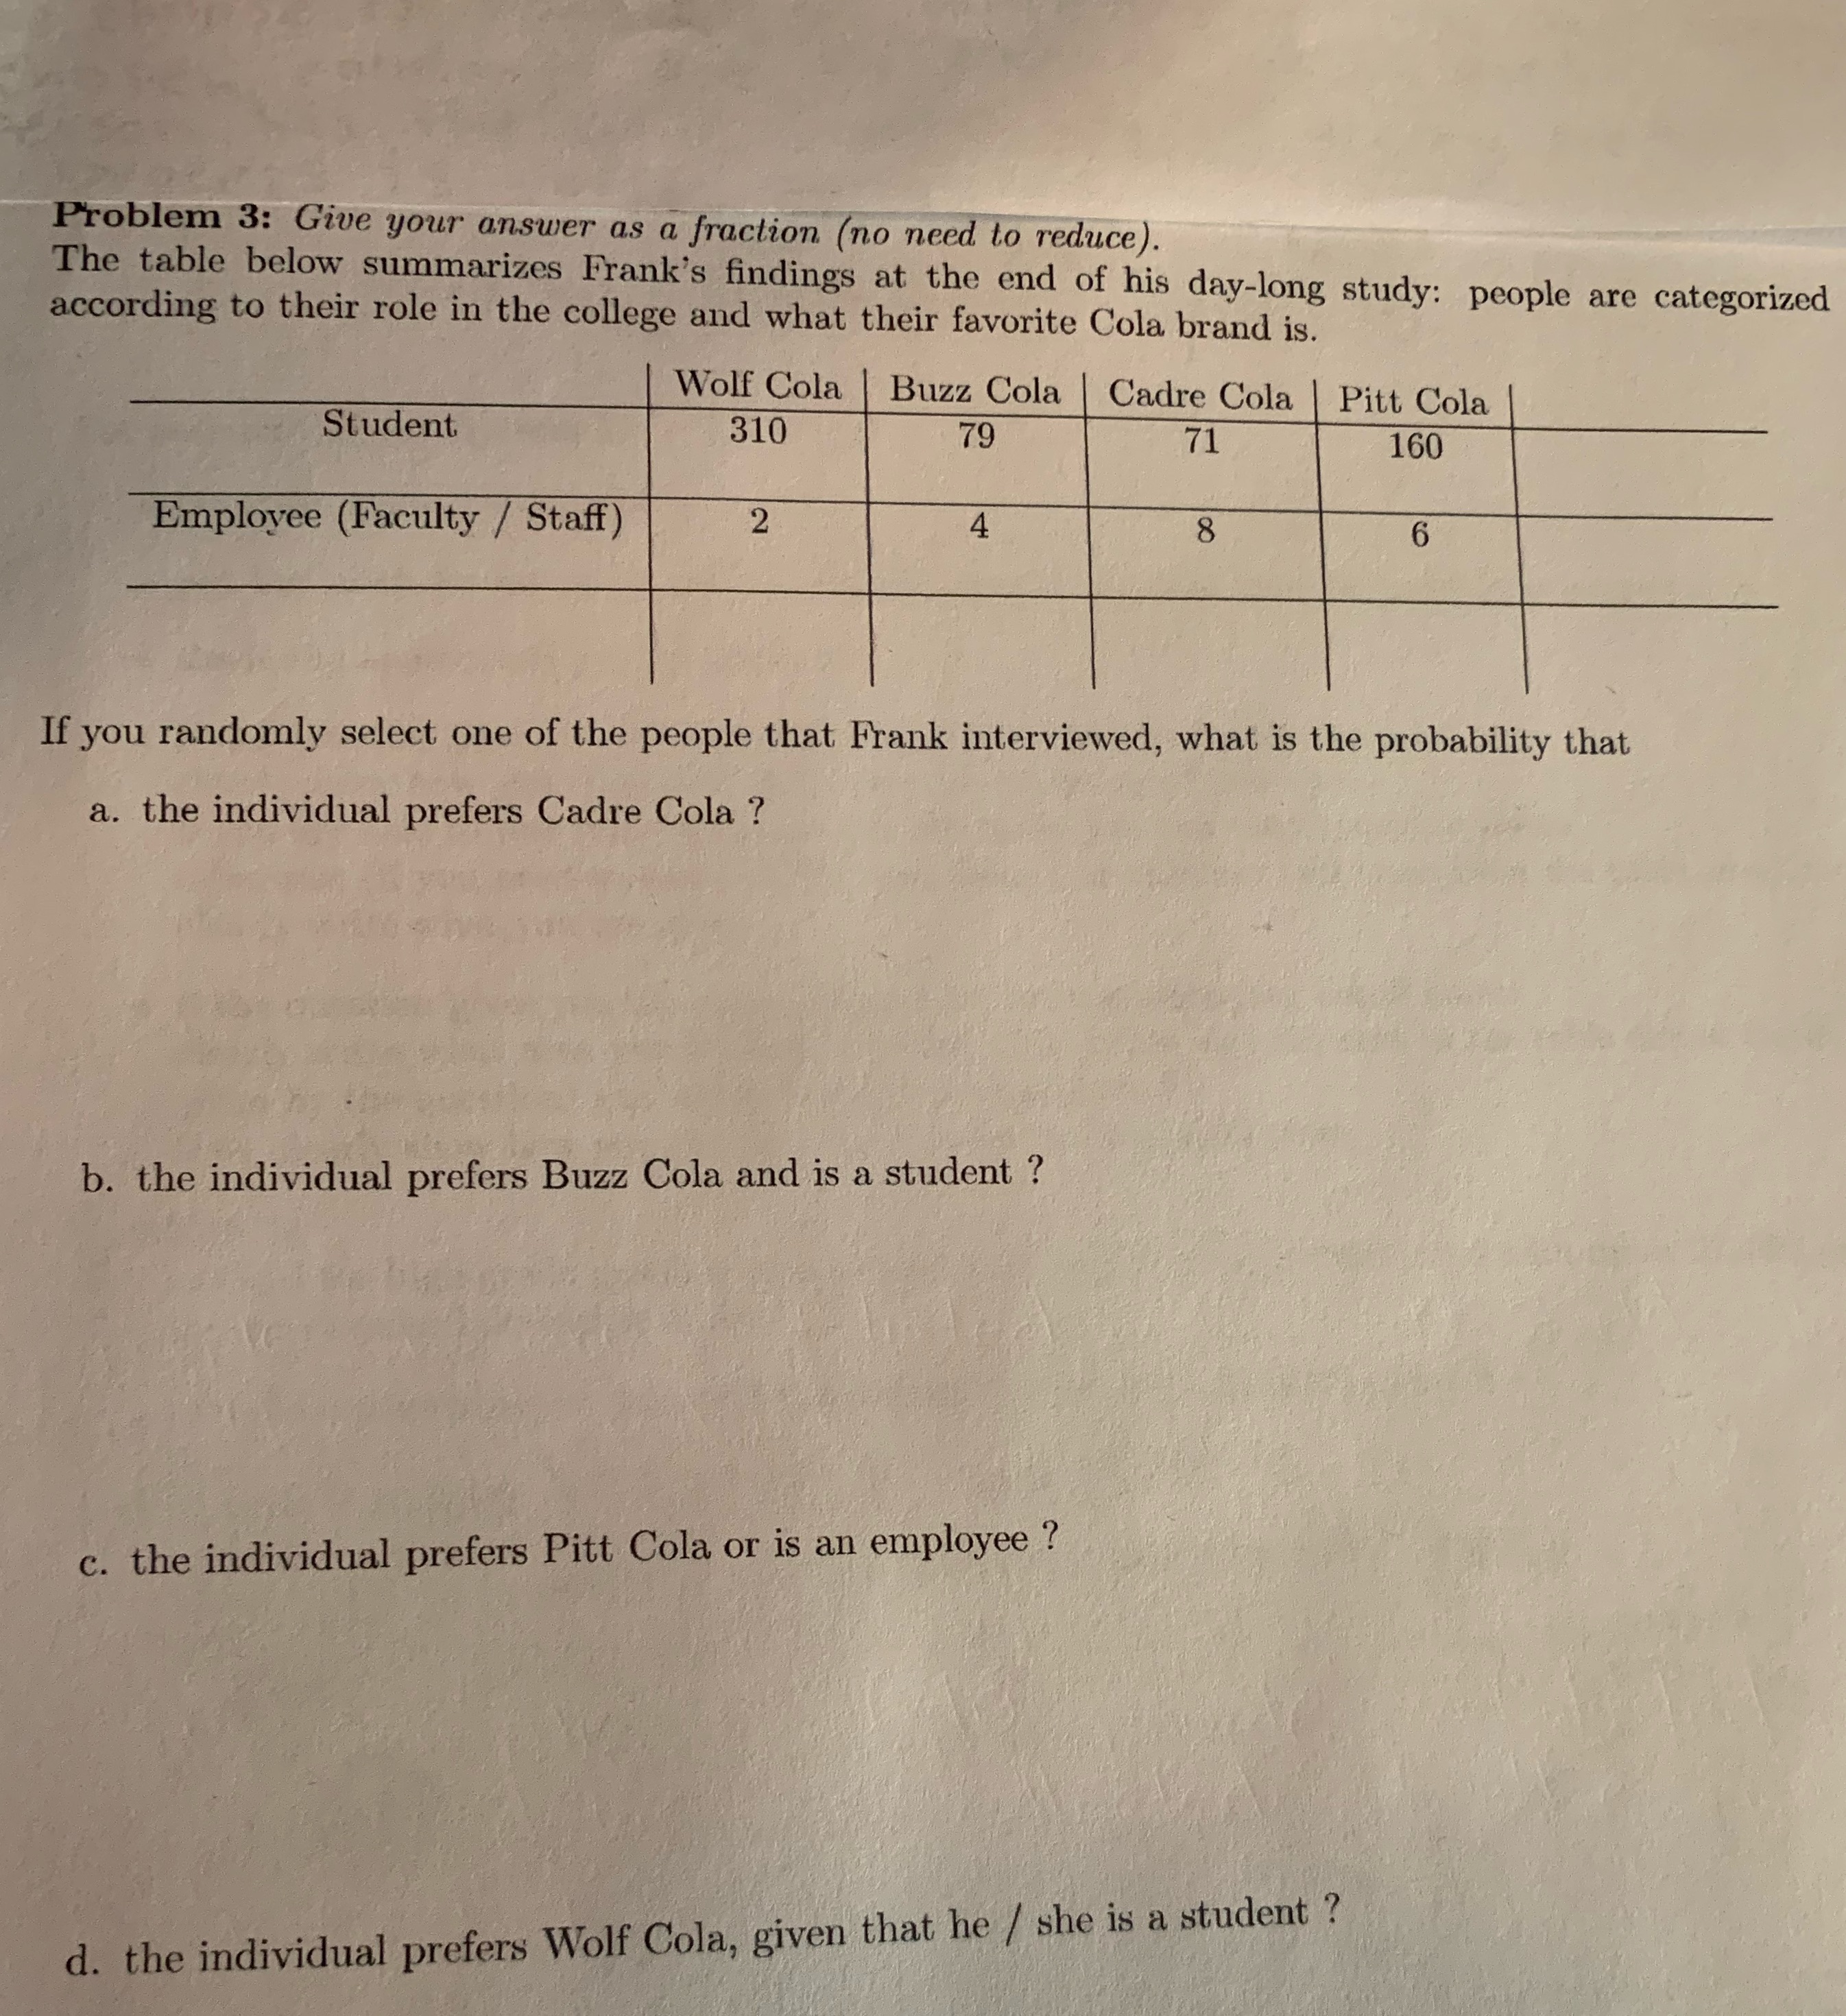
Problem 3: Give your answer as a fraction (no need to reduce). The table below summarizes Frank's findings at the end of his day-long study: people are categorized according to their role in the college and what their favorite Cola brand is. Wolf Cola | Buzz Cola | Cadre Cola | Pitt Cola Student 310 79 71 160 Employee (Faculty / Staff) 2 8 6 If you randomly select one of the people that Frank interviewed, what is the probability that a. the individual prefers Cadre Cola ? b. the individual prefers Buzz Cola and is a student ? c. the individual prefers Pitt Cola or is an employee ? d. the individual prefers Wolf Cola, given that he / she is a student
Step by Step Solution
There are 3 Steps involved in it

Get step-by-step solutions from verified subject matter experts