

Question: Problem 3. Baseball Statistics a) b) d) ', ', ', Below is a list of a few teams' batting averages versus their total number of
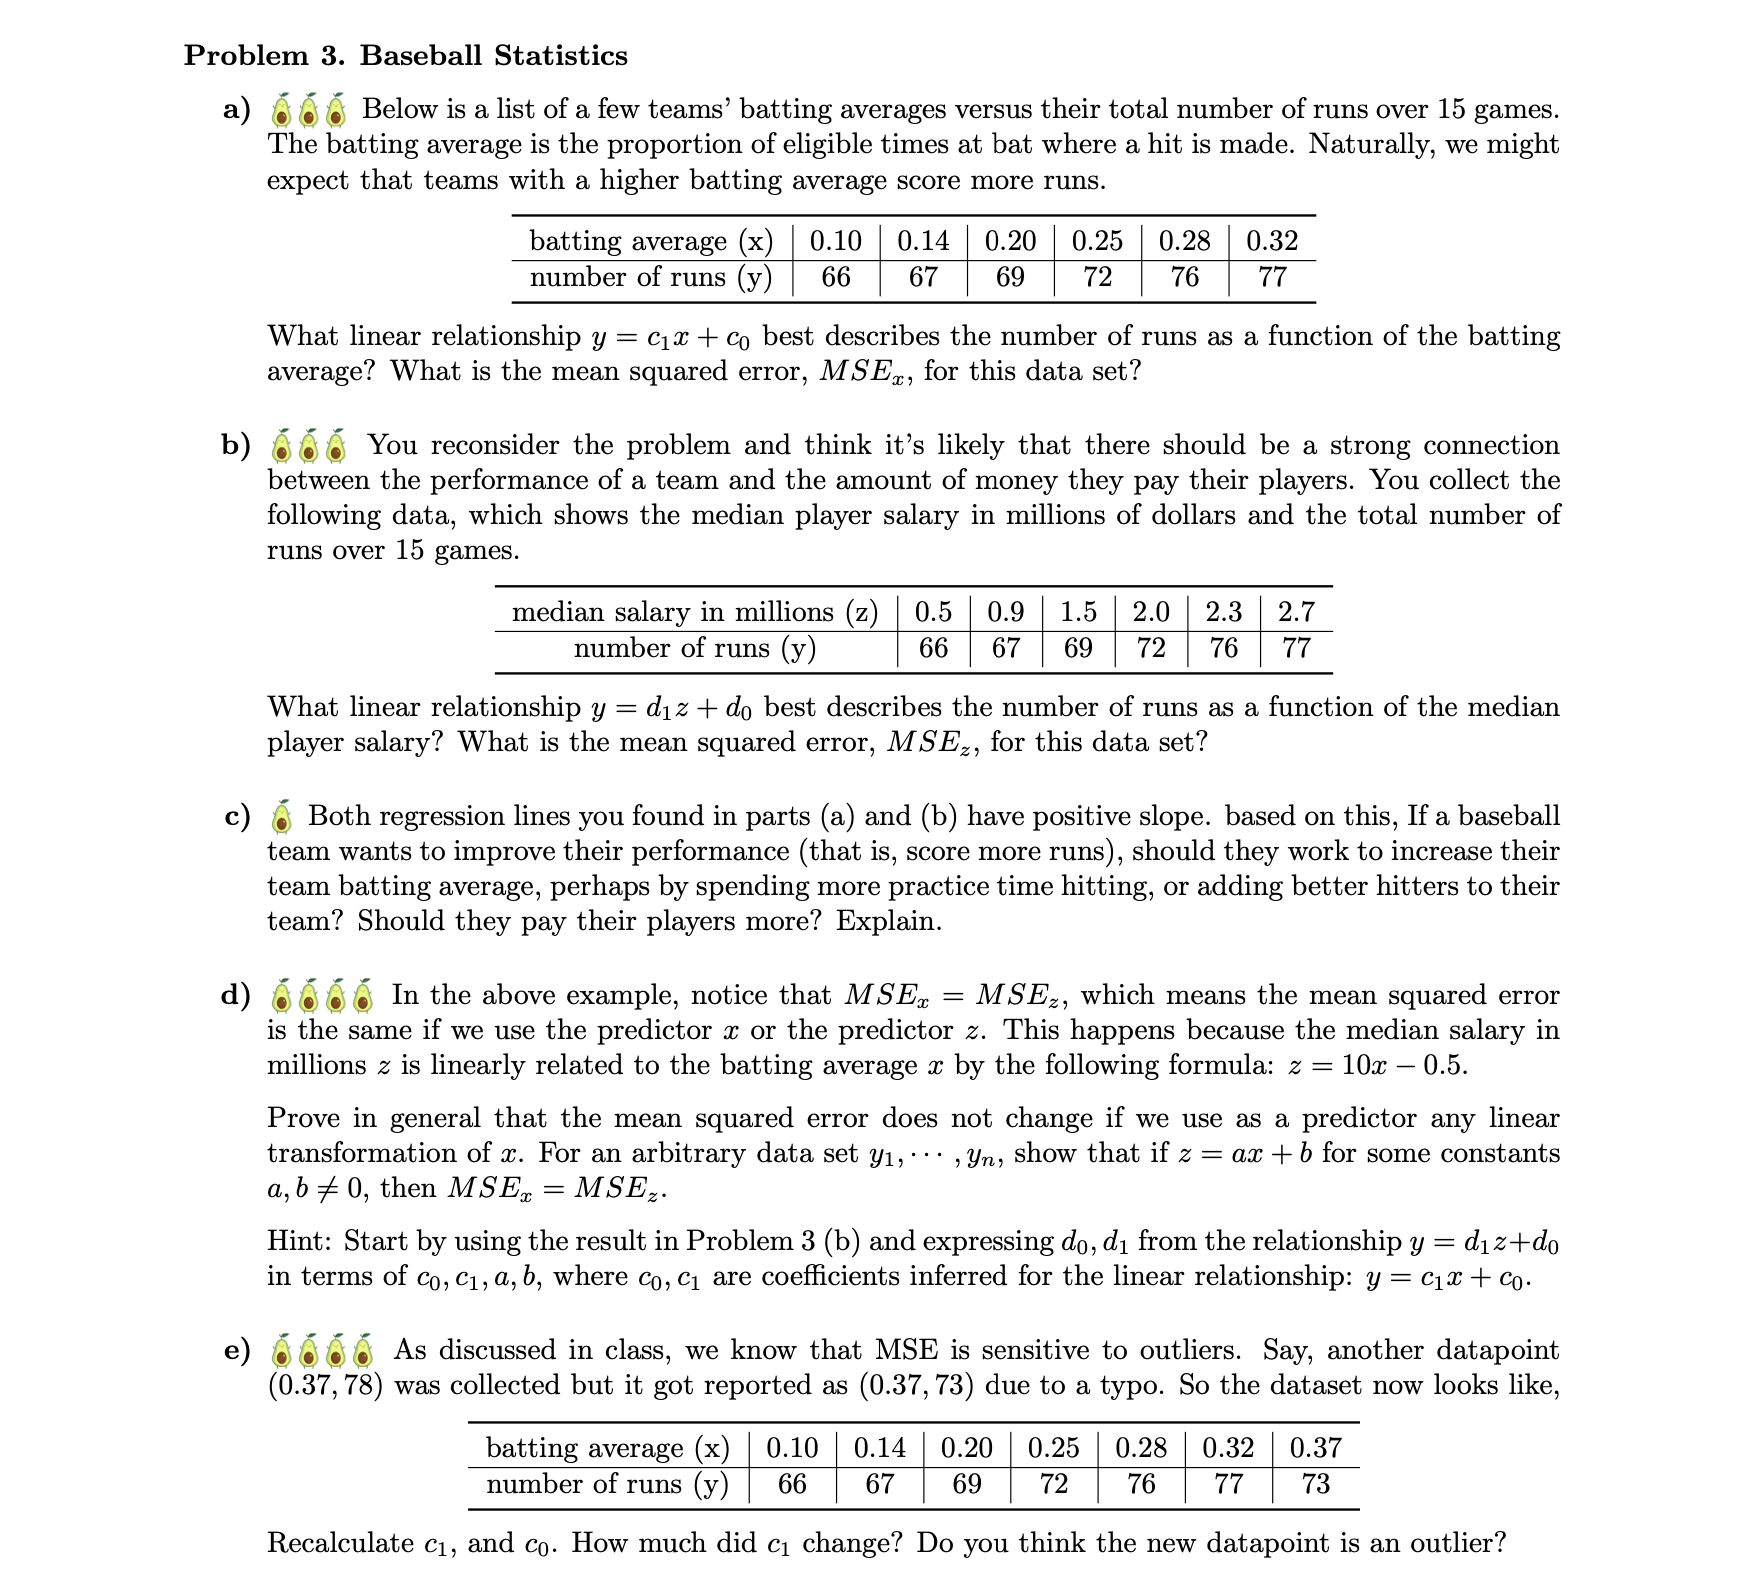
Problem 3. Baseball Statistics a) b) d) ', ', ', Below is a list of a few teams' batting averages versus their total number of runs over 15 games. The batting average is the proportion of eligible times at bat where a hit is made. Naturally, we might expect that teams with a higher batting average score more runs. batting average (x) 0.10 | 0.14 t 0.20 t 0.25 | 0.28 0.32 number of runs (y) 66 l 67 i 69 i 72 I 76 77 What linear relationship y : 01:13 + (:0 best describes the number of runs as a function of the batting average? What is the mean squared error, M SE33, for this data set? , 9 , You reconsider the problem and think it's likely that there should be a strong connection between the performance of a team and the amount of money they pay their players. You collect the following data, which shows the median player salary in millions of dollars and the total number of runs over 15 games. number of runs (y) t 6.6 t 6.7 t 6.9 t 72 r6 \\ 7'7 What linear relationship y = dlz + do best describes the number of runs as a function of the median player salary? What is the mean squared error, M SE2, for this data set? ; Both regression lines you found in parts (a) and (b) have positive slope. based on this, If a baseball team wants to improve their performance (that is, score more runs), should they work to increase their team batting average, perhaps by spending more practice time hitting, or adding better hitters to their team? Should they pay their players more? Explain. ; , g ; In the above example, notice that M SEQ, : M SEZ, which means the mean squared error is the same if we use the predictor a: or the predictor z. This happens because the median salary in millions z is linearly related to the batting average so by the following formula: 2 : 103: i 0.5. Prove in general that the mean squared error does not change if we use as a predictor any linear transformation of m. For an arbitrary data set yl, - - - ,yn, show that if z : a3: + b for some constants a,b % 0, then MSEx : MSEZ. Hint: Start by using the result in Problem 3 (b) and expressing d0, (11 from the relationship 3; : d12+d0 in terms of co, c1, 0., b, where c0, (:1 are coefcients inferred for the linear relationship: :1; : 613: + CD. 6 ; g ; As discussed in class, we know that MSE is sensitive to outliers. Say, another datapoint (0.37, 78) was collected but it got reported as (0.37, 73) due to a typo. So the dataset now looks like, batting average (x) t 0.10 | 0.14 0.20 t 0.25 0.28 | 0.32 t 0.37 number ofruns(y)' 66 l 67 69 i 72 76 I 77 i 73 Recalculate cl, and no. How much did cl change? Do you think the new datapoint is an outlier
Step by Step Solution
There are 3 Steps involved in it

Get step-by-step solutions from verified subject matter experts