

Question: PROBLEM 3 From the data shown in Table 2 and Table 3 for six mutully exclusive projet, determine which project, if any, should be selected.
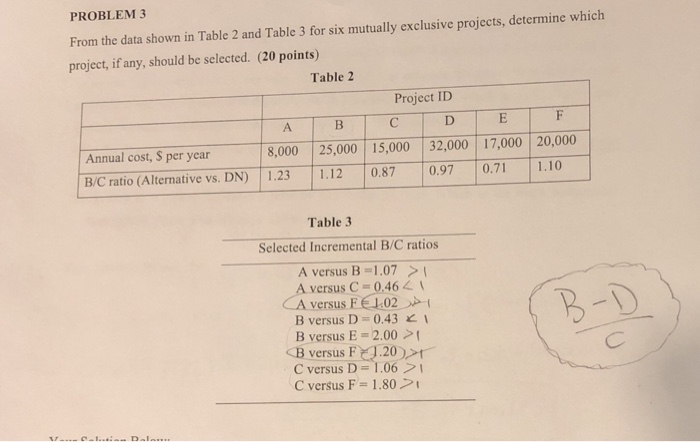
PROBLEM 3 From the data shown in Table 2 and Table 3 for six mutully exclusive projet, determine which project, if any, should be selected. (20 points) Table 2 Project ID Anualf cost, S per year 8,000 25,0005,000000 17,00 20,000 B/C ratio (Alternative vs. DN)|1.23 |1.12 |0.87-97-71 | 1.10 8,000 25,000 15,000 32,000 17,000 20,000 Table 3 Selected Incremental B/C ratios A versus B-1.07> versus C 0,464 versus F E102) B versus D 0.43K B versus E -2.00 B versus F .20 C versus D 1.06 C versus F 1.80 >
Step by Step Solution
There are 3 Steps involved in it
1 Expert Approved Answer
Step: 1 Unlock

Question Has Been Solved by an Expert!
Get step-by-step solutions from verified subject matter experts
Step: 2 Unlock
Step: 3 Unlock