

Question: Problem 3 : Match the following graphs to the relevant descriptions (NOTE: there may be one-to-zero, one-to-one or one-to-many matches) 1. This graph represents a
Problem 3: Match the following graphs to the relevant descriptions (NOTE: there may be one-to-zero, one-to-one or one-to-many matches)
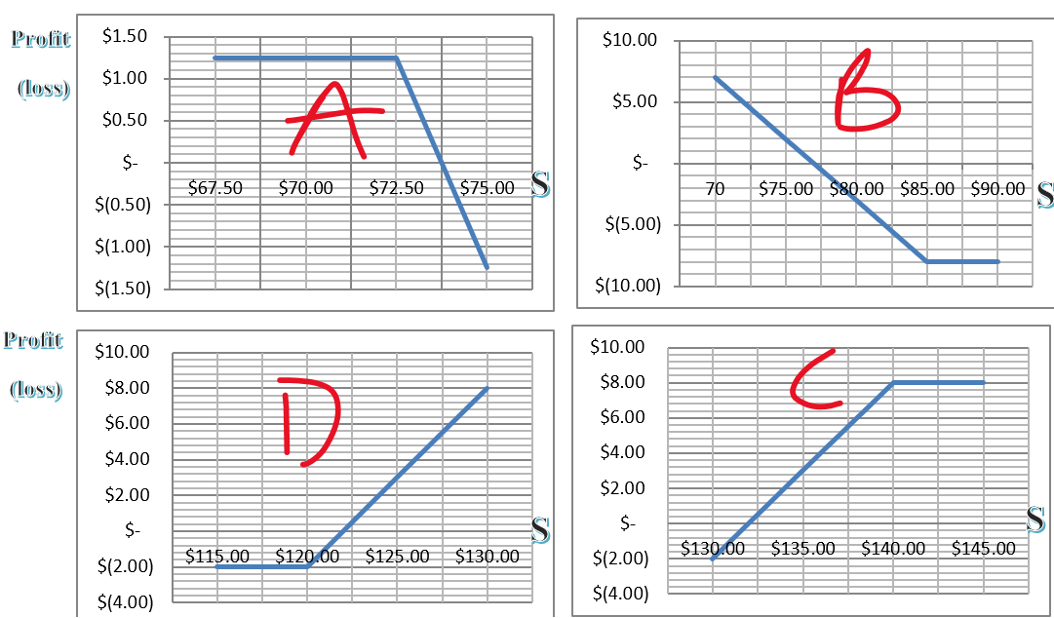
1. This graph represents a short put with a strike price of $140 per share, the premium is $0.80 per share with unlimited loss.
2. This graph represents a short call with a break-even price of $72.50 per share and the maximum gain of $1.25 per share.
3. This graph represents a long put with a strike price of $85 per share and the maximum loss of $8 per share.
4. This graph represents an obligation to buy stocks at an exercise price of $140 per share. At $132 per share, there will be neither profit nor loss in the position.
5. This graph represents the right to buy stocks at $125 per share with unlimited gains.
6. This graph represents a short put with a premium of $8 per share, unlimited loss and a break-even price of $135 per share.
7. This graph represents an obligation to sell stocks. At $72.50 per share, there is neither profit nor loss in this position.
8. This graph represents a short put with an exercise price of $140 per share and maximum gain of $8 per share.
Profit $1.50 $1.00 (Loss) $0.50 $- $(0.50) $(1.00) $(1.50) $10.00 $8.00 $6.00 $4.00 $2.00 $- $(2.00) $(4.00) Profit (Loss) A $67.50 $70.00 $72.50 $75.00 $115.00 $120.00 $125.00 $130.00 $10.00 $5.00 $- $(5.00) $(10.00) $10.00 $8.00 $6.00 $4.00 $2.00 $- $(2.00) $(4.00) 70 $75.00 $80.00 $85.00 $90.00 $130.00 $135.00 $140.00 $145.00
Step by Step Solution
There are 3 Steps involved in it

Get step-by-step solutions from verified subject matter experts